
Balance sheet structure, main items
Assets
The asset side of the Solvency II balance sheet is split into investments, assets held for unit-linked business and other assets. Investments represent those held by insurers in order to be able to fulfil the promises made to the policy-holder on an on-going basis. This excludes unit-linked business for which the investment risk is assumed by the policyholder. On an EEA wide basis, Figure 1 shows that the investment portfolio of insurers is dominated by bonds. Corporate and government bonds together account for more than 60% of the portfolio.
Figure 1: Investment mix by insurers in EEA following S.02 Balance sheet. 2016 Q3. %

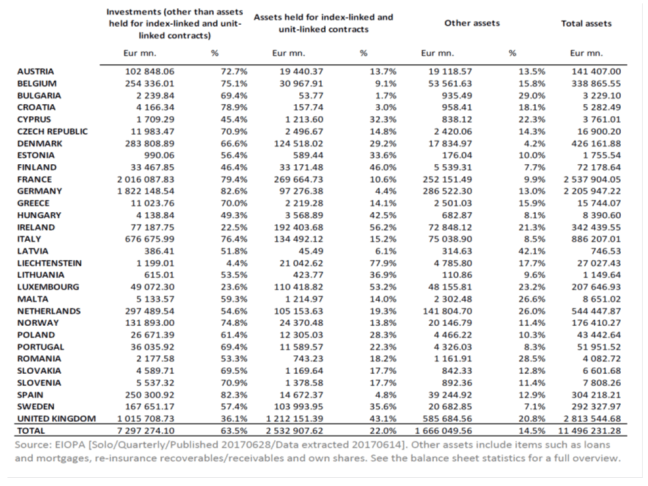
However, the investments shown in these figures represent only part of the balance sheet. There is also a considerable share of investments for unit-linked business. Table 1 shows the breakdown of total assets into three main categories (investments as shown above, assets held for unit-linked business and other assets). The share of unit-linked business (measured by assets) in the EEA was 21.9% in Q3-2016.
Table 1: Main categories of total assets by insurers in per country. 2016 Q3. EUR million and %
Liabilities
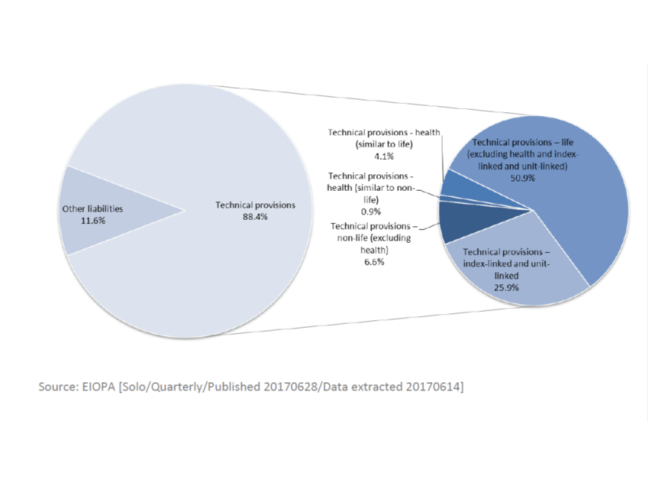
Total liabilities consist of technical provisions and other liabilities. This is illustrated on an EEA level in the Figure below. Technical provisions represent the amount of resources to be set aside to pay policy-holder claims and are split into 5 main categories. Other liabilities include debt such as subordinated liabilities and financial liabilities other than debts owed to credit institutions, but also other liabilities such as, for example, deposits from reinsurers.
Figure 2: Liability profile insurers in EEA. 2016-Q3. %
Premiums (Non-life)
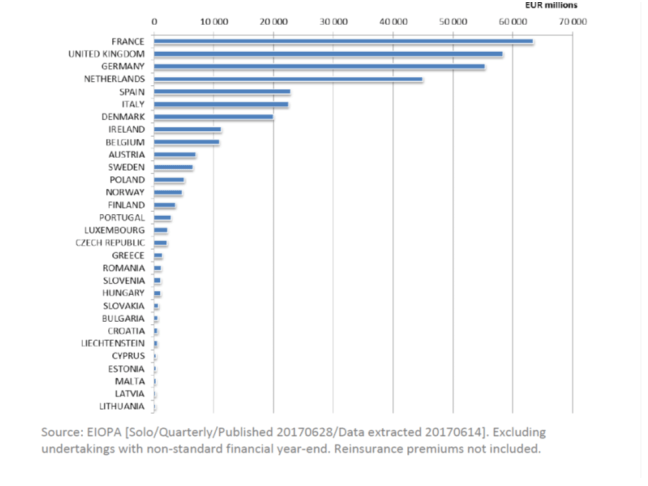
One way of assessing market size is to look at the gross (i.e. before reinsurance) written premiums by country. The Figure below ranks the countries according to the gross premiums written by undertakings in their jurisdiction in the first 3 quarters of 2016. At this stage the figure shows only premiums in the non-life segment, since life premiums are not available for Q3-2016 on a consistent basis. There is an ongoing process to eliminate some national differences in reporting of life premiums.
Figure 3: Non-life GWP (gross written premiums) per country. 2016 Q3 Year to date.
Source: EIOPA [Solo/Quarterly/Published 20170628/Data extracted 20170614]. Excluding undertakings with non-standard financial year-end. Reinsurance premiums not included.
Own funds and MCR/SCR ratios
Insurance undertakings are required by the Solvency II regulation to hold a certain amount of capital of sufficient quality in addition to the assets they hold to cover the contractual obligations towards policyholders. The amount of capital (called eligible own funds) required is defined by the Minimum Capital Requirement (MCR) and the Solvency Capital Requirement (SCR), which depend on the risks to which the undertaking is exposed.. If the amount of eligible own funds falls below the MCR, the insurance license should be withdrawn if appropriate coverage cannot be re-stablished within a short period of time. Holding enough eligible own funds to cover the SCR enables undertakings to absorb significant losses, even in difficult times. Undertakings’ compliance with the SCR therefore gives reasonable assurance to policyholders that payments will be made as they fall due.
The SCR is calculated either by using a prescribed formula (called the standard formula) or by employing an undertaking-specific partial or full internal model that has been approved by the supervisory authority. Being risk-sensitive the SCR is subject to fluctuations and undertakings are required to monitor it continuously, calculate it at least annually and re-calculate it whenever their overall risk changes significantly.
As non-compliance with the MCR jeopardizes policyholders’ interests, the MCR has to be re-calculated quarterly according to a given formula. The ratios shown in Table 2 are computed by dividing the respective eligible own funds by the SCR and MCR figures as reported by the insurance undertakings at the end of Q3 2016.
Table 2: MCR and SCR ratios by country. Weighted average and interquartile distribution. 2016 Q3

