The exponential digital social world

The exponential digital social world

Tech-savvy start-ups with natively digital business models regard this point in time as the best time in the history of the world to invent something. The world is buzzing with technology-driven opportunities leveraging the solid platform provided over the past 30 years, birthed from

  • the Internet,
  • then mobility,
  • social
  • and now the massive scale of cloud computing and the Internet of Things (IoT).

For the start-up community, this is a

  • platform for invention,
  • coupled with lowered / disrupted barriers,
  • access to venture capital,
  • better risk / benefit ratios
  • and higher returns through organisational agility.

Kevin Kelly, co-founder of Wired magazine believes we are poised to create truly great things and that what’s coming is exponentially different, beyond what we envisage today – ‘Today truly is a wide open frontier. We are all becoming. It is the best time ever in human history to begin’ (June 2016). Throughout history, there have been major economic and societal shifts and the revolutionary nature of these is only apparent retrospectively – at the time the changes were experienced as linear and evolutionary. But now is different. Information access is globalised and is seen as a democratic right for first world citizens and a human right for the less advantaged.

The genesis was the Internet and the scale is now exponential because cloud-based platforms embed connections between data, people and things into the very fabric of business and daily life. Economies are information and services-based and knowledge is a valued currency. This plays out at a global, regional, community and household level. Pro-active leaders of governments, businesses and communities addressing these trends stress the need for innovation and transformative change (vs incremental) to shape future economies and societies across the next few years. In a far reaching example of transformative vision and action, Japan is undertaking ‘Society 5.0’, a full national transformation strategy including policy, national digitisation projects and deep cultural changes. Society 5.0 sits atop a model of five waves of societal evolution to a ‘super smart society’. The ultimate state (5.0) is achieved through applying technological advancements to enrich the opportunities, knowledge and quality of life for people of all ages and abilities.

DD1

The Society 5.0 collaboration goes further than the digitisation of individual businesses and the economy, it includes all levels of the Japanese society, and the transformation of society itself. Society 5.0 is a framework to tackle several macro challenges that are amplified in Japan, such as an ageing population – today, 26.3% of the Japanese population is over 65, for the rest of the world, 20% of people will be over 60 by 2020. Japan is responding through the digitisation of healthcare systems and solutions. The increased mobility and flexibility of work to keep people engaged in meaningful employment, and the digitisation of social infrastructure across communities and into homes. This journey is paved with important technology-enabled advances, such as

  • IoT,
  • robotics,
  • artificial intelligence,
  • virtual and augmented reality,
  • big data analytics
  • and the integration of cyber and physical systems.

Japan’s transformation approach is about more than embracing digital, it navigates the perfect storm of technology change and profound changes in culture, society and business models. Globally, we are all facing four convergent forces that are shaping the fabric of 21st century life.

  • It’s the digital social world – engaging meaningfully with people matters, not merely transacting
  • Generational tipping point – millennials now have the numbers as consumers and workers, their value systems and ways of doing and being are profoundly different
  • Business models – your value chain is no longer linear, you are becoming either an ecosystem platform or a player / supplier into that ecosystem
  • Digital is ubiquitous – like particles in the atmosphere, digital is all around us, connecting people, data and things – it’s the essence of 21st century endeavours

How do leaders of our iconic, successful industrial era businesses view this landscape? Leaders across organisations, governments and communities are alert to the opportunities and threats from an always on economy. Not all leaders are confident they have a cohesive strategy and the right resources to execute a transformative plan for success in this new economy of knowledge, digital systems and the associated intangible assets – the digital social era. RocketSpace, a global ecosystem providing a network of campuses for start-up acceleration, estimate that 10 years from now, in 2027, 75% of today’s S&P 500 will be replaced by digital start-ups (RocketSpace Disruption Brief, March 2017). Even accounting for some potential skew in this estimate, we are in the midst of unprecedented change.

What is change about?

What are the strategic assets and capabilities that an organisation needs to have when bridging from the analogue to the digital world? Key to succeeding in this is taking the culture and business models behind successful start-ups and imbuing them into the mature enterprise. Organisations need to employ outside-in, stakeholder-centric design-thinking and adopt leveraged business models that create

  • scaled resources,
  • agility,
  • diversity of ideas

and headspace to

  • explore,
  • experiment,
  • fail and try again.

The need to protect existing assets and sources of value creation remains important. However, what drives value is changing, so a revaluation of portfolios is needed against a new balance sheet, the digital social balance sheet.

The Dimension Data Digital Social Balance Sheet evolved from analysing transformational activities with our global clients from the S&P500, the government sector, education and public health sectors and not-for-profits. We also learnt from collaborations with tech start-ups and our parent company, Nippon Telegraph and Telephone Group’s (NTT) R&D investment activities, where they create collaborative ecosystems referred to as B2B2X. The balance sheet represents the seven top level strategic capabilities driving business value creation in the digital social era. This holds across all industries, though it may be expressed differently and have different relative emphasis for various sectors – for example, stakeholders may include employees, partners, e-lance collaborators, customers, patients, shareholders or a congregation.

DD2

Across each capability we have defined five levels of maturity and this extends the balance sheet into the Dimension Data Digital Enterprise Capability Maturity Model. This is an holistic, globally standardised framework. From this innovative tool, organisations can

  • assess themselves today,
  • specify their target state,
  • conduct competitive benchmarking,
  • and map out a clear pathway of transitions for their business and stakeholders.

The framework can also be applied to construct your digital balance sheet reporting – values and measures can be monitored against organisational objectives.

Where does your organisation sit? Thinking about your best and worst experiences with a business or government organisation this year, what is revealed about their capabilities? Across each of the pillars of this model, technology is a foundation and an enabler of progressive maturity. For example, effective data architecture and data management platforming underpins the information value capability of responsiveness. A meaningful capability will be enabled by the virtual integration of hybrid data sources (internal systems, external systems, machines, sensors, social) for enhanced perception, discovery, insight and action by both knowledge workers and AI agents. Uber is a leading innovator in this, and is also applying deep learning, to predict demand and direct supply, not just in time, but just before time. In this, they are exploring beyond today’s proven and mainstream capabilities to generate unique business value.

Below is a high level assessment of three leading digitals at this point in their business evolution – Uber, Alibaba and the Estonian government. We infer their capabilities from our research of their organisational journeys and milestones, using published material such as articles and case studies, as well as our personal experiences engaging with their platforms. Note that each of these businesses’ capabilities are roughly in alignment across the seven pillars – this is key to sustainable value creation. For example, an updated online presence aimed at improving user experience delivers limited value if not integrated in real time across all channels, with information leveraged to learn and deepen engagement and processes designed around user context, able to adapt to fulfil the point in time need.
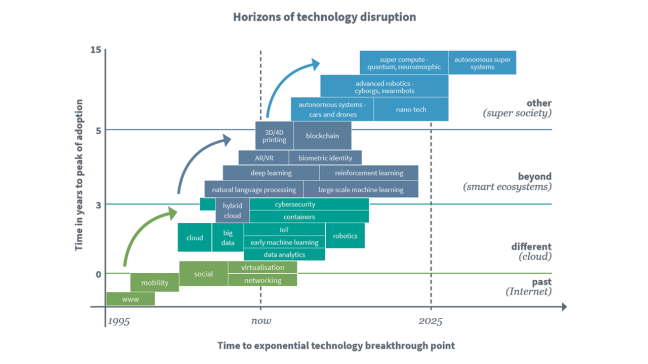
DD3

Innovation horizons

In the model below, key technology trends are shown. We have set out a view of their progression to exponential breakthrough (x axis) and the points at which these technologies will reach the peak of the adoption curve, flipping from early to late adopters (y axis). Relating this to the Digital Enterprise Capability Maturity Model, level 1 and 2 capabilities derive from what are now mature foundations (past). Level 3 aligns with what is different and has already achieved the exponential breakthrough point. Progressing to level 4 requires a preparedness to innovate and experiment with what is different and beyond. Level 5 entails an appetite to be a first mover, experimenting with technologies that will not be commercial for five to ten years, but potentially provide significant first mover advantage. This is where innovators such as Elon Musk’s horizons are set with Tesla and SpaceX.

An example of all of this coming together at level 3 of digital capability maturity and the different horizon – involving cloud, mobility, big data, analytics, IoT and cybersecurity – to enable a business to transform, is Amoury Sport Organisation (A.S.O.) and their running of the Tour de France. The Tour was conceived in 1903 as an event to promote and sell A.S.O.’s publications and is today the most watched annual sporting event in the world. Spectators, athletes and coaches are hungry for details and insights into the race and the athletes. Starting from the 2015 Tour, A.S.O. has leapt forward as a digital business. Data collected from sensors connected to the cyclist’s bike is aggregated on a secure, cloud-based, big data platform, analysed in real time and turned into entertaining insights and valuable performance statistics for followers and stakeholders of the Tour. This has opened up new avenues of monetisation for A.S.O. Dimension Data is the technology services partner enabling this IoT-based business platform.

DD4

If your organisation is not yet on the technology transformation path, consider starting now. For business to prosper from the digital economy, you must be platformed to enable success – ready and capable to seamlessly connect humans, machines and data and to assure secure ecosystem flows. The settings of our homes, cars, schools and learning institutions, health and fitness establishments, offices, cities, retail outlets, factories, defence forces, emergency services, logistics providers and other services are all becoming forever different in this digital atmosphere.

Where is your innovation horizon set? The majority of our co-innovation agendas with our clients are focused on the beyond horizons. In relation to this, we see four pairs of interlinked technologies being most impactful

  • artificial intelligence and robotics;
  • virtual/ augmented reality and the human machine interface;
  • nano-technology and 3D/4D printing,
  • and cybersecurity and the blockchain.

Artificial intelligence and robotics

Artificial intelligence (AI) is both a science and set of technologies inspired by the way humans sense, perceive, learn, reason, and act.

We are rapidly consuming AI and embedding it into our daily living, taking it for granted. Think about how we rely upon GPS and location services, use Google for knowledge, expect Facebook to identify and tag faces, ask Amazon to recommend a good read and Spotify to generate a personalised music list, not so long ago, these technologies were awe-inspiring.

Now, and into the next 15 years, there is an AI revolution underway, a constellation of different technologies coming together to propel AI forward as a central force in society. Our relationships with machines will become more nuanced and personalised. There’s a lot to contemplate here. We really are at a juncture where discussion is needed at all levels about the ways that we will and won’t deploy AI to promote democracy and prosperity and equitably share the wealth created from it.

The areas in which this will have the fastest impact are transportation, traditional employment and workplaces, the home, healthcare, education, public safety and security and entertainment. Let’s look at examples from some of these settings:

Transportation – Autonomous vehicles encapsulate IoT, all forms of machine learning, computer vision and also robotics. This will soon break through the exponential point, once the physical hardware systems are robust enough.

Healthcare – there is significant potential for use of AI in pure and applied research and healthcare service delivery, as well as aged and disability related services. The collection of data from clinical equipment e.g. MRI scanners and surgical robots, clinical electronic health records, facility-based room sensors, personal monitoring devices, and mobile apps is allowing for more complete digital health records to be compiled. Analysis of these records will evolve clinical understandings. For example, NTT Data provides a Unified Clinical Archive Service for radiologists, providing machine learning interpretation of MRI brain imagery. The service provides digital translations of MRI brain scans and contains complete data sets of normal brain functions (gathered from John Hopkins University in the US). Radiologists are able to quantitatively evaluate their patient results with the normal population to improve diagnostics. Each new dataset adds to the ecosystem of knowledge.

Education – AI promises to enhance education at all levels, particularly in providing personalisation at scale for all learners. Interactive machine tutors are now being matched to students. Learning analytics can detect how a student is feeling, how they will perform and what the best likely interventions to improve learning outcomes are. Online learning has also enabled great teachers to boost their class numbers to worldwide audiences, while at the same time, student’s individual learning needs can be augmented through analysis of their response to the global mentor. Postgraduate and professional learning is set to become more modular and flexible, with AI used to assess current skills and work related projects and match learning modules of most immediate career value – an assemble your own degree approach. Virtual reality along with AI, is also changing learning content and pathways to mastery, and so will be highly impactful. AI will never replace good teaching, and so the meaningful integration of AI with face-to-face teaching will be key.

Public safety and securityCybersecurity is a key area for applied AI. Machine learning from AI against the datasets from ubiquitously placed cameras and drones for surveillance is a key area. In areas of tax, financial services, insurance and international policing, algorithms are improving the conduct of fraud investigations. A significant driver for advances in deep learning, particularly in video and audio processing has come off the back of anti-terrorist analytics. All of these things are now coming together in emergency response planning and orchestration and in the emerging field of predictive policing.

Virtual reality/augmented reality and the human machine interface

The lines between the physical and digital worlds are merging, along the ‘virtuality’ continuum of augmented and virtual reality. Augmented reality (AR) technologies overlay digital information on the ‘real world’, the digital information is delivered via a mechanism, such as a heads-up display, smart glass wall or wrist display. Virtual reality (VR) immerses a person in an artificial environment where they interact with data, their visual senses (and others) controlled by the VR system. Augmented virtuality blends AR and VR. As virtuality becomes part of our daily lives, the way we will interact with each other, learn, work, and transact are being re-shaped.

At the 2017 NTT R&D Fair in Tokyo, the use of VR in sports coaching and the spectator experience was showcased, with participants able to experience playing against elite tennis and baseball players and riding in the Tour de France. A VR spectator experience also enabled the direct experience the rider’s view and the sensation of the rider’s heart rate and fatigue levels. These applications of VR and AI are being rapidly incorporated into sports analytics and coaching.

Other enterprise VR use cases include

  • teaching peacekeeping skills to troops in conflict zones,
  • the creation of travel adventures,
  • immersion in snowy climate terrain to reduce pain for burn victims,
  • teaching autistic teenagers to drive,
  • and 3D visualisations of organs prior to conducting surgery.

It isn’t hard to imagine the impact on educational and therapeutic services, government service delivery, a shopping experience, on social and cultural immersion for remote communities and on future business process design and product engineering.

Your transformation journey

Every business is becoming a digital business. Some businesses are being caught off guard by the pace and nature of change. They are finding themselves reactive, pulled into the digital social world by the forces of disruption and the new rules of engagement set by clients, consumers, partners, workers and competitors. Getting on the front foot is important in order to control your destiny and assure future success. The disruptive forces upon us present opportunities to create a new future and value for your organisation and stakeholders. There are also risks, but the risk management approach of doing nothing is not viable in these times.

Perhaps your boardroom and executive discussions need to step back from thinking about the evolution of the current business and think in an unconstrained ‘the art of possible’ manner as to the impact of the global digital disruption and sources of value creation into the future. What are the opportunities, threats and risks that these provide? What is in the best interests of the shareholders? How will you retain and improve your sector competitiveness and use digital to diversify?

Is a new industry play now possible? Is your transformed digital business creating the ecosystem (acting as a platform business) or operating within another? How will it drive the business outcomes and value you expect and some that you haven’t envisaged at this point?

The digital balance sheet and seven pillars of digital enterprise capability could be used as the paving blocks for your pathway from analogue to digital. The framework can also guide and measure your progressive journey.

DD5

Our experiences with our clients globally show us that the transformation journey is most effective when executed across three horizons of change. Effective three step horizon planning follows a pattern for course charting, with a general flow of:

  1. Establish – laying out the digital fabric to create the core building blocks for the business and executing the must do/no regret changes that will uplift and even out capability maturity to a minimum of level 2.
  2. Extend – creating an agile, cross-functional and collaborative capability across the business and executing a range of innovation experiments that create options, in parallel with the key transformative moves.
  3. Enhance – embedding the digital social balance sheet into ‘business as usual’, and particularly imbuing innovation to continuously monitor, renew and grow the organisation’s assets.

In this, there are complexities and nuances of the change, including:

  • Re-balancing of the risk vs opportunity appetite from the board
  • Acceptable ROI models
  • The ability of the organisation to absorb change
  • Dependencies across and within the balance sheet pillars
  • Maintaining transitional balance across the pillars
  • Managing finite resources – achieving operational cost savings to enable the innovation investment required to achieve the target state

The horizon plans also need to have flex – so that pace and fidelity can be dialled up or down to respond to ongoing disruption and the dynamic operational context of your organisation.

Don’t turn away from analogue wisdom, this is an advantage. Born-digital enterprises don’t have established physical channels and presence, have not experienced economic cycles and lack longitudinal wisdom. By valuing analogue experience and also embracing the essence of outside-in thinking and the new digital social business models, the executive can confidently execute.

A key learning is that the journey is also the destination – by

  • mobilising cross functional teams,
  • drawing on diverse skills and perspectives,

empowered to act using quality information that is meaningful to them – this uplifts your organisational capabilities and in itself will become one of your most valuable assets.

Click here to access Dimension Data’s detailed study

Mastering Financial Customer Data at Multinational Scale

Your Customer Data…Consolidated or Chaotic?

In an ideal world, you know your customers. You know

  • who they are,
  • what business they transact,
  • who they transact with,
  • and their relationships.

You use that information to

  • calculate risk,
  • prevent fraud,
  • uncover new business opportunities,
  • and comply with regulatory requirements.

The problem at most financial institutions is that customer data environments are highly chaotic. Customer data is stored in numerous systems across the company. Most, if not all of which, has evolved over time in siloed environments according to business function. Each system has its

  • own management team,
  • technology platform,
  • data models,
  • quality issues,
  • and access policies.

Tamr1

This chaos prevents the firms from fully achieving and maintaining a consolidated view of customers and their activity.

The Cost of Chaos

A chaotic customer data environment can be an expensive problem in a financial institution. Customer changes have to be implemented in multiple systems, with a high likelihood of error or inconsistency because of manual processes. Discrepancies with the data leads to inevitable remediation activities that are widespread, and costly.

Analyzing customer data within one global bank required three months to compile and validate its correctness. The chaos leads to either

  1. prohibitively high time and cost of data preparation or
  2. garbage-in, garbage-out analytics.

The result of customer data chaos is an incredibly high risk profile — operational, regulatory, and reputational.

Eliminating the Chaos 1.0

Many financial services companies attempt to eliminate this chaos and consolidate their customer data.

A common approach is to implement a master data management (MDM) system. Customer data from different source systems is centralized into one place where it can be harmonized. The output is a “golden record,” or master customer record.

A lambda architecture permits data to stream into the centralized store and be processed in realtime so that it is immediately mastered and ready for use. Batch processes run on the centralized store to perform periodic (daily, monthly, quarterly, etc.) calculations on the data.

First-generation MDM systems centralize customer data and unify it by writing ETL scripts and matching rules.

Tamr2

The harmonizing often involves:

  1. Defining a common, master schema in which to store the consolidated data
  2. Writing ETL scripts to transform the data from source formats and schemas into the new common storage format
  3. Defining rule sets to deduplicate, match/cluster, and otherwise cleanse within the central MDM store

There are a number of commercial MDM solutions available that support the deterministic approach outlined above. The initial experience with those MDM systems, integrating the first five or so large systems, is often positive. Scaling MDM to master more and more systems, however, becomes a challenge that grows exponentially, as we’ll explain below.

Rules-based MDM, and the Robustness- Versus-Expandability Trade Off

The rule sets used to harmonize data together are usually driven off of a handful of dependent attributes—name, legal identifiers, location, and so on. Let’s say you use six attributes to stitch together four systems, A and B, and then the same six attributes between A and C, then A and D, B and C, B and D, and C and D. Within that example of 4 systems, you would have twenty four potential attributes that you are aligning. Add a fifth system, it’s 60 attributes; a sixth system, 90 attributes. So the effort to master additional systems grows exponentially. And in most multinational financial institutions, the number of synchronized attributes is not six; it’s commonly 50 to 100.

And maintenance is equally burdensome. There’s no guarantee that your six attributes maintain their validity or veracity over time. If any of these attributes need to be modified, then rules need to be redefined across the systems all over again.

The trade off for many financial institutions is robustness versus expandability. In other words, you can have a large-scale data mastering implementation and have it wildly complex, or you can do something small and have it highly accurate.

This is problematic for most financial institutions, which have very large-scale customer data challenges.

Customer Data Mastering at Scale

In larger financial services companies, especially multinationals, the number of systems in which customer data resides is much larger than the examples above. It is not uncommon to see financial companies with over 100 large systems.

Among those are systems that have been:

  • Duplicated in many countries to comply with data sovereignty regulations
  • Acquired via inorganic growth, purchased companies bringing in their own infrastructure for trading, CRM, HR, and back office. Integrating these can take a significant amount of time and cost

tamr3

When attempting to master a hundred sources containing petabytes of data, all of which have data linking and matching in different ways across a multitude of attributes and systems, you can see that the matching rules required to harmonize your data together gets incredibly complex.

Every incremental source added to the MDM environment can take thousands of rules to be implemented. Within just a mere handful of systems, the complexity gets to a point where it’s unattainable. As that complexity goes up, the cost of maintaining a rules-based approach also scales wildly, requiring more and more data stewards to make sure all the stitching rules remain correct.

Mastering data at scale is one of the riskiest endeavors a business can take. Gartner reports that 85% of MDM projects fail. And MDM budgets of $10M to $20M per year are not uncommon in large multinationals. With such high stakes, making sure that you get the right approach is critical to making sure that this thing is a success.

A New Take on an Old Paradigm

What follows is a reference architecture. The approach daisy chains together three large tool sets, each with appropriate access policies enforced, that are responsible for three separate steps in the mastering process:

  1. Raw Data Zone
  2. Common Data Zone
  3. Mastered Data Zone

tamr4

Raw Data Zone The first sits on a traditional data lake model—a landing area for raw data. Data is replicated from source systems to the centralized data repository (often built on Hadoop). Data is replicated in real time (perhaps via Kafka) wherever possible so that data is most up to date. For source systems that do not support real-time replication, nightly batch jobs or flat-file ingestion are used.

Common Data Zone Within the Common Data Zone, we take all of the data from the Raw Zone—with the various different objects, in different shapes and sizes, and conform that into outputs that look and feel the same to the system, with the same column headers, data types, and formats.

The toolset in this zone utilizes machine learning models to categorize data that exists within the Raw Data Zone. Machine learning models are trained on what certain attributes look like—what’s a legal entity, or a registered address, or country of incorporation, or legal hierarchy, or any other field. It does so without requiring anyone having to go back to the source system owners to bog them down with questions about that, saving weeks of effort.

This solution builds up a taxonomy and schema for the conformed data as raw data is processed. Unlike early-generation MDM solutions, this substantially reduces data unification time, often by months per source system, because there is:

  • No need to pre-define a schema to hold conformed data
  • No need to write ETL to transform the raw data

One multinational bank implementing this reference architecture reported being able to conform the raw data from a 10,000-table system within three days, and without using up source systems experts’ time defining a schema or writing ETL code. In terms of figuring out where relevant data is located in the vast wilderness this solution is very productive and predictable.

Mastered Data Zone In the third zone, the conformed data is mastered, and the outputs of the mastering process are clusters of records that refer to the same real-world entity. Within each cluster, a single, unified golden, master record of the entity is configured. The golden customer record is then distributed to wherever it’s needed:

  • Data warehouses
  • Regulatory (KYC, AML) compliance systems
  • Fraud and corruption monitoring
  • And back to operational systems, to keep data changes clean at the source

As with the Common Zone, machine learning models are used. These models eliminate the need to define hundreds of rules to match and deduplicate data. Tamr’s solution applies a probabilistic model that uses statistical analysis and naive Bayesian modeling to learn from existing relationships between various attributes, and then makes record-matching predictions based on these attribute relationships.

Tamr matching models require training, which usually takes just a few days per source system. Tamr presents a data steward with its predictions, and the steward can either confirm or deny them to help Tamr perfect its matching.

With the probabilistic model, Tamr looks at all of the attributes on which it has been trained, and based on the attribute matching, the solution will indicate a confidence level of a match being accurate. Depending on a configurable confidence level threshold, It will disregard entries that fall below the threshold from further analysis and training.

As you train Tamr and correct it, it becomes more accurate over time. The more data you throw at te solution, the better it gets. Which is a stark contrast to the rules-based MDM approach, where the more data you throw at it, it tends to break because the rules can’t keep up with the level of complexity.

Distribution A messaging bus (e.g., Apache Kafka) is often used to distribute mastered customer data throughout the organization. If a source system wants to pick up the master copy from the platform, it subscribes to that topic on the messaging bus to receive the feed of changes.

Another approach is to pipeline deltas from the MDM platform into target system in batch.

Real-world Results

This data mastering architecture is in production at a number of large financial institutions. Compared with traditional MDM approaches, the model-driven approach provides the following advantages:

70% fewer IT resources required:

  • Humans in the entity resolution loop are much more productive, focused on a relatively small percentage (~5%) of exceptions that the machine learning algorithms cannot resolve
  • Eliminates ETL and matching rules development
  • Reduces manual data synchronization and remediation of customer data across systems

Faster customer data unification:

  • A global retail bank mastered 35 large IT systems within 6 months—about 4 days per source system
  • New data is mastered within 24 hours of landing in the Raw Data Zone
  • A platform for mastering any category of data—customer, product, suppler, and others

Faster, more complete achievement of data-driven business initiatives:

  • KYC, AML, fraud detection, risk analysis, and others.


Click here to access Tamr’s detailed analysistamr4

Data Search and Discovery in Insurance – An Overview of AI Capabilities

Historically, the insurance industry has collected vast amounts of data relevant to their customers, claims, and so on. This can be unstructured data in the form of PDFs, text documents, images, and videos, or structured data that has been organized for big data analytics.

As with other industries, the existence of such a trove of data in the insurance industry led many of the larger firms to adopt big data analytics and techniques to find patterns in the data that might reveal insights that drive business value.

Any such big data applications may require several steps of data management, including collection, cleansing, consolidation, and storage. Insurance firms that have worked with some form of big data analytics in the past might have access to structured data which can be ingested by AI algorithms with little additional effort on the part of data scientists.

The insurance industry might be ripe for AI applications due to the availability of vast amounts of historical data records and the existence of large global companies with the resources to implement complex AI projects. The data being collected by these companies comes from several channels and in different formats, and AI search and discovery projects in the space require several initial steps to organize and manage data.

Radim Rehurek, who earned his PhD in Computer Science from the Masaryk University Brno and founded RARE Technologies, points out:

« A majority of the data that insurance firms collect is likely unstructured to some degree. This poses several challenges to insurance companies in terms of collecting and structuring data, which is key to the successful implementation of AI systems. »

Giacomo Domeniconi, a post-doctoral researcher at IBM Watson TJ Research Center and Adjunct Professor for the course “High-Performance Machine Learning” at New York University, mentions structuring the data as the largest challenge for businesses:

“Businesses need to structure their information and create labeled datasets, which can be used to train the AI system. Yet creating this labeled dataset might be very challenging apply AI and in most cases would involve manually labeling a part of the data using the expertise of a specialist in the domain.”

Businesses face many challenges in terms of collecting and structuring their data, which is key to the successful implementation of AI systems. An AI application is only as good as the data it consumes.

Natural language processing (NLP) and machine learning models often need to be trained on large volumes of data. Data scientists tweak these models to improve their accuracy.

This is a process that might last several months from start to finish, even in cases where the model is being taught relatively rudimentary tasks, such as identifying semantic trends in an insurance company’s internal documentation.

Most AI systems necessarily require the data to be input into an AI system in a structured format. Businesses would need to collect, clean, and organize their data to meet these requirements.

Although creating NLP and machine learning models to solve real-world business problems is by itself a challenging task, this process cannot be started without a plan for organizing and structuring enough data for these models to operate at reasonable accuracy levels.

Large insurance firms might need to think about how their data at different physical locations across the world might be affected by local data regulations or differences in data storage legacy systems at each location. Even with all the data being made accessible, businesses would find that data might still need to be scrubbed to remove any incorrect, incomplete, improperly formatted, duplicate, or outlying data. Businesses would also find that in some cases regulations might mandate the signing of data sharing agreements between the involved parties or data might need to be moved to locations where it can be analyzed. Since the data is highly voluminous, moving the data accurately can prove to be a challenge by itself.

InsIA

Click here to access Iron Mountain – Emerj’s White Paper


The State of Connected Planning

We identify four major planning trends revealed in the data.

  • Trend #1: Aggressively growing companies plan more, plan better, and prioritize planning throughout the organization.

  • Trend #2: Successful companies use enterprise-scale planning solutions.

  • Trend #3: The right decisions combine people, processes, and technology.

  • Trend #4: Advanced analytics yield the insights for competitive advantage.

TREND 01 : Aggressively growing companies prioritize planning throughout the organization

Why do aggressively growing companies value planning so highly? To sustain an aggressive rate of growth, companies need to do two things:

  • Stay aggressively attuned to changes in the market, so they can accurately anticipate future trend
  • Keep employees across the company aligned on business objectives

This is why aggressively growing companies see planning as critical to realizing business goals.

Putting plans into action

Aggressively growing companies don’t see planning as an abstract idea. They also plan more often and more efficiently than other companies. Compared to their counterparts, aggressively growing companies plan with far greater frequency and are much quicker to incorporate market data into their plans

This emphasis on

  • efficiency,
  • speed,
  • and agility

produces real results. Compared to other companies, aggressively growing companies put more of their plans into action. Nearly half of aggressively growing companies turn more than three-quarters of their plans into reality.

For companies that experience a significant gap between planning and execution, here are three ways to begin to close it:

  1. Increase the frequency of your planning. By planning more often, you give yourself more flexibility, can incorporate market data more quickly, and have more time to change plans. A less frequent planning cadence, in contrast, leaves your organization working to incorporate plans that may lag months behind the market.
  2. Plan across the enterprise. Execution can go awry when plans made in one area of the business don’t take into account activities in another area. This disconnect can produce unreachable goals throughout the business, which can dramatically reduce the percentage of a plan that gets executed. To avoid this, create a culture of planning across the enterprise, ensuring that plans include relevant data from all business units.
  3. Leverage the best technology. As the statistic above shows, the companies who best execute on their plans are those who leverage cloud-based enterprise technology. This ensures that companies can plan with all relevant data and incorporate all necessary stakeholders. By doing this, companies can set their plans up for execution as they are made.

Anaplan1

TREND 02 : Successful companies use enterprise-scale planning solutions

Although the idea that planning assists all aspects of a business may seem like common sense, the survey data suggests that taking this assumption seriously can truly help companies come out ahead.

Executives across industries and geographies all agreed that planning benefits every single business outcome, including

  • enhancing revenues,
  • managing costs,
  • optimizing resources,
  • aligning priorities across the organization,
  • making strategies actionable,
  • anticipating market opportunities,
  • and responding to market changes.

In fact, 92 percent of businesses believe that better planning technology would provide better business outcomes for their company. Yet planning by itself is not always a panacea.

Planning does not always equal GOOD planning. What prepares a company for the future isn’t the simple act of planning. It’s the less-simple act of planning well. In business planning, band-aids aren’t solutions

What counts as good planning? As businesses know, planning is a complicated exercise,
involving multiple processes, many different people, and data from across the organization. Doing planning right, therefore, requires adopting a wide-angle view. It requires planners to be able to see past their individual functions and understand how changes in one part of the organization affect the organization as a whole.

The survey results suggest that the best way to give planners this enterprise-level perspective is to use the right technology. Companies whose technology can incorporate data from the entire enterprise are more successful. Companies whose planning technology cannot link multiple areas of the organization, or remove multiple obstacles to planning, in contrast, plan less successfully.

Here are three areas of consideration that can help you begin your Connected Planning journey.

  1. Get the right tools. Uncertainty and volatility continue to grow, and spreadsheets and point solutions lack the agility to pivot or accommodate the volumes of data needed to spot risks and opportunities. Consider tools such as cloud-based, collaborative Connected Planning platforms that use in-memory technology and execute real-time modeling with large volumes of data. Not only can teams work together but plans become more easily embraced and achievable.
  2. Operate from a single platform with reliable data. Traditionally, companies have used individual applications to plan for each business function. These solutions are usually disconnected from one another, which makes data unreliable and cross-functional collaboration nearly impossible. A shared platform that brings together plans with access to shared data reduces or altogether eliminates process inefficiencies and common errors that can lead to bad decision-making.
  3. Transform planning into a continuous, connected process. Sales, supply chain, marketing, and finance fulfill different purposes within the business, but they are inextricably linked and rely on each other for success. The ability to connect different business units through shared technology, data, and processes is at the core of a continuous and connected business planning process.

Anaplan2

TREND 03 The right decisions combine people, processes, and technology

As businesses examine different ways to drive faster, more effective decision-making, planning plays a critical role in meeting this goal. Ninety-nine percent of businesses say that planning is important to managing costs. According to 97 percent of all survey respondents,

  • enhancing revenues,
  • optimizing resource allocation,
  • and converting strategies into actions

are all business objectives for which planning is extremely crucial. Eighty-two percent of executives consider planning to be “critically important” for enhancing revenues.

For planning to be successful across an organization, it need to extend beyond one or two siloed business units. The survey makes this clear: 96 percent of businesses state that
planning is important for aligning priorities across the organization. Yet even though companies recognize planning as a critical business activity, major inefficiencies exist: 97 percent of respondents say that their planning can be improved.

The more planners, the merrier the planning

When describing what they could improve in their planning, four components were all named essential by a majority of respondents.

  • Having the right processes
  • Involving the right people
  • Having the right data
  • Having the right technology

To support strong and effective change management initiatives, successful businesses can build a Center of Excellence (COE). A COE is an internal knowledge-sharing community that brings domain expertise in creating, maturing, and sustaining high-performing business disciplines. It is comprised of an in-house team of subject matter experts who train and share best practices throughout the organization.

By designing a Center of Excellence framework, businesses can get more control over their planning processes with quality, speed, and value, especially as they continue to expand Connected Planning technology into more complex use cases across the company.

Here are six primary benefits that a COE can provide:

  1. Maintaining quality and control of the planning platform as use case expands.
  2. Establishing consistency to ensure reliability within best practices and business data.
  3. Fostering a knowledge-sharing environment to cultivate and develop internal expertise.
  4. Enabling up- and downstream visibility within a single, shared tool.
  5. Driving efficiency in developing, releasing, and maintaining planning models.
  6. Upholding centralized governance and communicating progress, updates, and value to executive sponsors.

Anaplan3

TREND 04 Advanced analytics yield the insights for competitive advantage

Disruption is no longer disruptive for businesses—it’s an expectation. Wide-spread globalization, fluid economies, emerging technologies, and fluctuating consumer demands make unexpected events and evolving business models the normal course of business today.

This emphasizes the critical need for a more proactive, agile, and responsive state of planning. As the data shows, companies that have implemented a more nimble approach to planning are more successful.

Planners don’t have to look far to find better insights. Companies who plan monthly or more are more likely to quickly incorporate new market data into their plans—updating forecasts and plans, assessing the impacts of changes, and keeping an altogether closer eye on ongoing business performance and targets.

However, not all companies are able to plan so continuously: Almost half of respondents indicate that it takes them weeks or longer to update plans with market changes. For businesses that operate in rapidly changing and competitive markets, this lag in planning can be a significant disadvantage.

Advancements in technology can alleviate this challenge. Ninety-two percent of businesses state that improved planning technology would provide better business outcomes for their company. The C-Suite, in particular, is even more optimistic about the adoption of improved technology: More than half of executives say that adopting better planning technology would result in “dramatically better” business performance.

Planning goes digital

Rather than planners hunting for data that simply validates a gut-feeling approach to planning, the survey results indicate that data now sits behind the wheel—informing, developing, improving, and measuring plans.

Organizations, as well as a majority of executives, describe digital transformation as a top priority. Over half of all organizations and 61 percent of executives say that digital transformation amplifies the importance of planning. As businesses move into the future, the increasing use of advanced analytics, which includes predictive analytics and spans to machine learning and artificial intelligence, will determine which businesses come out ahead.

Roadblocks to data-driven planning

Increasing uncertainty and market volatility make it imperative that businesses operate with agile planning that can be adjusted quickly and effectively. However, as planning response times inch closer to real time, nearly a third of organizations continue to cite two main roadblocks to implementing a more data-driven approach:

  • inaccurate planning data and
  • insufficient technology

Inaccurate data plagues businesses in all industries. Sixty-three percent of organizations that use departmental or point solutions, for example, and 59 percent of businesses that use on-premises solutions identify “having the right data” as a key area for improvement in planning. The use of point solutions, in particular, can keep data siloed. When data is stored in disparate technology across the organization, planners end up spending more time consolidating systems and information, which can compromise data integrity.

It’s perhaps these reasons that lead 46 percent of the organizations using point and on-premises solutions to say that better technologies are necessary to accommodate current market conditions. In addition, 43 percent of executives say that a move to cloud-based technology would benefit existing planning.

In both cases, data-driven planning remains difficult, as businesses not employing cloud-based, enterprise technology struggle with poor data accuracy. By moving to cloud-based technology, businesses can automate and streamline tedious processes, which

  • reduces human error,
  • improves productivity,
  • and provides stakeholders with increased visibility into performance.

State-of-planning research reveals that organizations identify multiple business planning
obstacles as equally problematic, indicating a need for increased analytics in solutions that can eliminate multiple challenges at once. Nearly half of all respondents shared a high desire for a collaborative platform that can be used by all functions and departments.

Highly analytical capabilities in planning solutions further support the evolving needs of
today’s businesses. In sales forecasting, machine learning methodologies can quickly analyze past pipeline data to make accurate forecast recommendations. When working in financial planning, machine learning can help businesses analyze weather, social media, and historical sales data to quickly discern their impact on sales.

Here are some additional benefits that machine learning methodologies in a collaborative planning platform can offer businesses:

  1. Manage change to existing plans and respond to periods of uncertainty with accurate demand forecasting and demand sensing
  2. Develop enlightened operations, real-time forecasting, and smart sourcing and resourcing plans
  3. Operations that maintain higher productivity and more control with lower maintenance costs
  4. Targeted customer experience programs that increase loyalty and improve customer engagement
  5. Products and services that are offered at the right price with effective trade promotions, resulting in higher conversions

Anaplan4

Click here to access Anaplan’s detailed White Paper

EIOPA reviews the use of Big Data Analytics in motor and health insurance

Data processing has historically been at the very core of the business of insurance undertakings, which is rooted strongly in data-led statistical analysis. Data has always been collected and processed to

  • inform underwriting decisions,
  • price policies,
  • settle claims
  • and prevent fraud.

There has long been a pursuit of more granular data-sets and predictive models, such that the relevance of Big Data Analytics (BDA) for the sector is no surprise.

In view of this, and as a follow-up of the Joint Committee of the European Supervisory Authorities (ESAs) cross-sectorial report on the use of Big Data by financial institutions,1 the European Insurance and Occupational Pensions Authority (EIOPA) decided to launch a thematic review on the use of BDA specifically by insurance firms. The aim is to gather further empirical evidence on the benefits and risks arising from BDA. To keep the exercise proportionate, the focus was limited to motor and health insurance lines of business. The thematic review was officially launched during the summer of 2018.

A total of 222 insurance undertakings and intermediaries from 28 jurisdictions have participated in the thematic review. The input collected from insurance undertakings represents approximately 60% of the total gross written premiums (GWP) of the motor and health insurance lines of business in the respective national markets, and it includes input from both incumbents and start-ups. In addition, EIOPA has collected input from its Members and Observers, i.e. national competent authorities (NCAs) from the European Economic Area, and from two consumers associations.

The thematic review has revealed a strong trend towards increasingly data-driven business models throughout the insurance value chain in motor and health insurance:

  • Traditional data sources such as demographic data or exposure data are increasingly combined (not replaced) with new sources like online media data or telematics data, providing greater granularity and frequency of information about consumer’s characteristics, behaviour and lifestyles. This enables the development of increasingly tailored products and services and more accurate risk assessments.

EIOPA BDA 1

  • The use of data outsourced from third-party data vendors and their corresponding algorithms used to calculate credit scores, driving scores, claims scores, etc. is relatively extended and this information can be used in technical models.

EIOPA BDA 2

  • BDA enables the development of new rating factors, leading to smaller risk pools and a larger number of them. Most rating factors have a causal link while others are perceived as being a proxy for other risk factors or wealth / price elasticity of demand.
  • BDA tools such as such as artificial intelligence (AI) or machine learning (ML) are already actively used by 31% of firms, and another 24% are at a proof of concept stage. Models based on these tools are often cor-relational and not causative, and they are primarily used on pricing and underwriting and claims management.

EIOPA BDA 3

  • Cloud computing services, which reportedly represent a key enabler of agility and data analytics, are already used by 33% of insurance firms, with a further 32% saying they will be moving to the cloud over the next 3 years. Data security and consumer protection are key concerns of this outsourcing activity.
  • Up take of usage-based insurance products will gradually continue in the following years, influenced by developments such as increasingly connected cars, health wearable devices or the introduction of 5G mobile technology. Roboadvisors and specially chatbots are also gaining momentum within consumer product and service journeys.

EIOPA BDA 4

EIOPA BDA 5

  • There is no evidence as yet that an increasing granularity of risk assessments is causing exclusion issues for high-risk consumers, although firms expect the impact of BDA to increase in the years to come.

In view of the evidence gathered from the different stake-holders, EIOPA considers that there are many opportunities arising from BDA, both for the insurance industry as well as for consumers. However, and although insurance firms generally already have in place or are developing sound data governance arrangements, there are also risks arising from BDA that need to be further addressed in practice. Some of these risks are not new, but their significance is amplified in the context of BDA. This is particularly the case regarding ethical issues with the fairness of the use of BDA, as well as regarding the

  • accuracy,
  • transparency,
  • auditability,
  • and explainability

of certain BDA tools such as AI and ML.

Going forward, in 2019 EIOPA’s InsurTech Task Force will conduct further work in these two key areas in collaboration with the industry, academia, consumer associations and other relevant stakeholders. The work being developed by the Joint Committee of the ESAs on AI as well as in other international fora will also be taken into account. EIOPA will also explore third-party data vendor issues, including transparency in the use of rating factors in the context of the EU-US insurance dialogue. Furthermore, EIOPA will develop guidelines on the use of cloud computing by insurance firms and will start a new workstream assessing new business models and ecosystems arising from InsurTech. EIOPA will also continue its on-going work in the area of cyber insurance and cyber security risks.

Click here to access EIOPA’s detailed Big Data Report

Is Your Company Ready for Artificial Intelligence?

Overview

Companies are rushing to invest in and pursue initiatives that use artificial intelligence (AI). Some hope to find opportunity to transform their business processes and gain competitive advantage and others are concerned about falling behind the technology curve. But the reality is that many AI initiatives don’t work as planned, largely because companies are not ready for AI.

However, it is possible to leverage AI to create real business value. The key to AI success is ensuring the organization is ready by having the basics in place, particularly structured analytics and automation. Other elements of AI readiness include

  • executive engagement and support,
  • data excellence,
  • organizational capabilities,
  • and completion of AI pilots.

Key Takeaways

There is tremendous AI hype and investment. Artificial intelligence is software that can make decisions without explicit instructions for each scenario, including an ability to learn and improve over time. The term “machine learning” is often used interchangeably with AI, but machine learning is just one approach to AI, though it is currently the approach generating the most attention. Today in most business situations where AI is relevant, machine learning is likely to be employed.

The hype around AI is tremendous and has accelerated in the last few years. It is rare to read a business-related article these days that doesn’t mention AI.

The AI hype is being accompanied by massive investments from corporations (like Amazon, Google, and Uber), as well as from venture capital firms.

Because organizations often pursue AI without fully understanding it or having the basics in place, many AI initiatives fail. The AI fervor is causing companies to hurriedly pursue AI. There is a rush to capitalize on AI, but significant frustration when it comes to actually delivering AI success. AI initiatives are often pursued for the wrong reasons and many AI initiatives experience pitfalls. Some key pitfalls are:

  • Expensive partnerships between large companies and startups without results.
  • Impenetrable black box systems.
  • Open source toolkits without programmers to code.

The root cause for these failures often boils down to companies confusing three different topics:

  • automation,
  • structured analytics,
  • and artificial intelligence.

AI1

Despite the challenges, some organizations are experiencing success with AI. While the hype around AI is overblown, there are organizations having success by leveraging AI to create business value, particularly when AI is used for customer support and in the back office.

The key to AI success is first having the basics in place. In assessing AI successes and failures, the presenters drew three conclusions:

  1. There is a huge benefit from first getting the basics right: automation and structured analytics are prerequisites to AI.
  2. The benefits from AI are greater once these basics have been done right.
  3. Organizations are capable of working with AI at scale only when the basics have been done at scale.

GETTING THE BASICS RIGHT

The most important basics for AI are automation and structured analytics.

  • Automation: In most businesses there are many examples of data processes that can be automated. In many of these examples, there is no point having advanced AI if the basics are not yet automated.
  • Structured analytics means applying standard statistical techniques to well-structured data. In most companies there is huge value in getting automation and structured analytics right before getting to more complicated AI.

Examples of how businesses use structured analytics and automation include:

  • Competitor price checking. A retailer created real-time pricing intelligence by automatically scraping prices from competitors’ websites.
  • Small business cash flow lending product. Recognizing the need for small business customers to acquire loans in days, not weeks, a bank created an online lending product built on structured analytics.

BENEFITS WHEN THE BASICS ARE IN PLACE

Once the basics of structured analytics and automation are in place, organizations see more value from AI—when AI is used in specific situations.

AI2

Examples of how adding AI on top of the basics helps improve business results are:

  • New product assortment decisions. Adding AI on top of structured analytics allowed a retailer to predict the performance of new products for which there was no historic data. With this information, the retailer was able to decide whether or not to add the product to the stores.
  • Promotions forecasting. A retailer was able to improve forecasting of promotional sales using AI. Within two months of implementation, machine learning was better than the old forecasts plus the corrections made by the human forecasting team.
  • Customer churn predictions. A telephone company used AI and structured analytics to identify how to keep at-risk customers from leaving.
  • Defect detection. An aerospace manufacturer used AI to supplement human inspection and improve defect detection.

AI AT SCALE AFTER THE BASICS ARE AT SCALE

Once an organization proves it can work with automation and structured analytics at scale, it is ready for AI at scale. Readiness for AI at scale goes beyond completing a few AI pilots in defined but isolated areas of capability; the basics need to be in use across the business.

Before undertaking AI, organizations need to assess their AI readiness. To be successful, organizations need to be ready for AI. Readiness consists of multiple elements, including

  • executive engagement and support,
  • data excellence,
  • organizational capabilities,
  • and an analytical orientation.

Organizations often struggle with data excellence and organizational capabilities.

AI3

Click here to access HBR and SAS article collection

The Future of Planning Budgeting and Forecasting

The world of planning, budgeting and forecasting is changing rapidly as new technologies emerge, but the actual pace of change within the finance departments of most organizations is rather more sluggish. The progress companies have made in the year since The Future of Planning, Budgeting and Forecasting 2016 has been incremental, with a little accuracy gained but very little change to the reliance on insight-limiting technologies like spreadsheets.

That said, CFOs and senior finance executives are beginning to recognize the factors that contribute to forecasting excellence, and there is a groundswell of support for change. They’ll even make time to do it, and we all know how precious a CFOs time can be, especially when basic improvements like automation and standardization haven’t yet been implemented.

The survey shows that most PBF functions are still using relatively basic tools, but it also highlights the positive difference more advanced technology like visualization techniques and charting can make to forecasting outcomes. For the early adopters of even more experimental technologies like machine learning and artificial intelligence, there is some benefit to being at the forefront of technological change. But the survey suggests that there is still some way to go before machines take over the planning, budgeting and forecasting function.

In the meantime, senior finance executives who are already delivering a respected, inclusive and strategic PBF service need to focus on becoming more insightful, which means using smart technologies in concert with non-financial data to deliver accurate, timely, long term forecasts that add real value to the business.

Making headway

CFOs are making incremental headway in improving their planning, budgeting and forecasting processes, reforecasting more frequently to improve accuracy. But spreadsheet use remains a substantial drag on process improvements, despite organizations increasingly looking towards new technologies to progress the PBF landscape.

That said, respondents seem open to change, recognizing the importance of financial planning and analysis as a separate discipline, which will help channel resources in that direction. At the moment, a slow and steady approach is enough to remain competitive, but as more companies make increasingly substantial changes to their PBF processes to generate better insight, those that fail to speed up will find they fall behind.

Leading the debate

FSN’s insights gleaned from across the finance function shed light on the changes happening within the planning, budgeting and forecasting function, and identify the processes that make a real difference to outcomes. Senior finance executives are taking heed of these insights and making changes within the finance function. The most important one is the increasing inclusion of non-financial data into forecasting and planning processes. The Future of The Finance Function 2016 identified this as a game-changer, for the finance function as a whole, and for PBF in particular. It is starting to happen now. Companies are looking towards data from functions outside of finance, like customer relationship management systems and other non-financial data sources.

Senior executives are also finally recognizing the importance of automation and standardization as the key to building a strong PBF foundation. Last year it languished near the bottom of CFO’s priority lists, but now it is at the top. With the right foundation, PBF can start to take advantage of the new technology that will improve forecasting outcomes, particularly in the cloud.

There is increasing maturity in the recognition of cloud solution benefits, beyond just cost, towards agility and scalability. With recognition comes implementation, and it is hoped that uptake of these technologies will follow with greater momentum.

Man vs machine

Cloud computing has enabled the growth of machine learning and artificial intelligence solutions, and we see these being embedded into our daily lives, in our cars, personal digital assistants and home appliances. In the workplace, machine learning tools are being used for

  • predictive maintenance,
  • fraud detection,
  • customer personalization
  • and automating finance processes.

In the planning, budgeting and forecasting function, machine learning tools can take data over time, apply parameters to the analysis, and then learn from the outcomes to improve forecasts.

On the face of it, machine learning appears to be a game changer, adding unbiased logic and immeasurable processing power to the forecasting process, but the survey doesn’t show a substantial improvement in forecasting outcomes for organizations that use experimental technologies like these. And the CFOs and senior finance executives who responded to the survey believe there are substantial limitations to the effective of machine forecasts. As the technology matures, and finance functions become more integrated, machine learning will proliferate, but right now it remains the domain of early adopters.

Analytic tools

Many of the cloud solutions for planning, budgeting and forecasting involve advanced analytic tools, from visualization techniques to machine learning. Yet the majority of respondents still use basic spreadsheets, pivot tables and business intelligence tools to mine their data for forecasting insight. But they need to be upgrading their toolbox.

The survey identifies users of cutting edge visualization tools as the most effective forecasters. They are more likely to utilize specialist PBF systems, and have an arsenal of PBF technology they have prioritized for implementation in the next three years to improve their forecasts.

Even experimental organizations that aren’t yet able to harness the full power of machine learning and AI, are still generating better forecasts than the analytic novices.

The survey results are clear, advanced analytics must become the new baseline technology, it is no longer enough on rely on simple spreadsheets and pivot tables when your competitors are several steps ahead.

Insight – the top trump

But technology can’t operate in isolation. Cutting edge tools alone won’t provide the in-depth insight that is needed to properly compete against nimble start-ups. CFOs must ensure their PBF processes are inclusive, drawing input from outside the financial bubble to build a rounded view of the organization. This will engender respect for the PBF outcomes and align them with the strategic direction of the business.

Most importantly though, organizations need to promote an insightful planning, budgeting and forecasting function, by using advanced analytic techniques and tools, coupled with a broad data pool, to reveal unexpected insights and pathways that lead to better business performance.

As FSN stated, today’s finance organizations are looking to:

  • provide in-depth insights;
  • anticipate change and;
  • verify business opportunities before they become apparent to competitors.

But AI and machine learning technologies are still too immature. And spreadsheet-based processes don’t have the necessary functions to fill these advanced needs. While some might argue that spreadsheet-based processes could work for small businesses, they become unmanageable as companies grow.

PBF

Click here to access Wolters Kluwers FSN detailed survey report