How To Build a CX Program And Transform Your Business

Customer Experience (CX) is a catchy business term that has been used for decades, and until recently, measuring and managing it was not possible. Now, with the evolution of technology, a company can build and operationalize a true CX program.

For years, companies championed NPS surveys, CSAT scores, web feedback, and other sources of data as the drivers of “Customer Experience” – however, these singular sources of data don’t give a true, comprehensive view of how customers feel, think, and act. Unfortunately, most companies aren’t capitalizing on the benefits of a CX program. Less than 10% of companies have a CX executive and of those companies, only 14% believe Customer Experience, as a program, is the aggregation and analysis of all customer interactions with the objective of uncovering and disseminating insights across the company in order to improve the experience. In a time where the customer experience separates the winners from the losers, CX must be more of a priority for ALL businesses.

This not only includes the analysis of typical channels in which customers directly interact with your company (calls, chats, emails, feedback, surveys, etc.) but all the channels in which customers may not be interacting directly with you – social, reviews, blogs, comment boards, media, etc.

CX1

In order to understand the purpose of a CX team and how it operates, you first need to understand how most businesses organize, manage, and carry out their customer experiences today.

Essentially, a company’s customer experience is owned and managed by a handful of teams. This includes, but is not limited to:

  • digital,
  • brand,
  • strategy,
  • UX,
  • retail,
  • design,
  • pricing,
  • membership,
  • logistics,
  • marketing,
  • and customer service.

All of these teams have a hand in customer experience.

In order to affirm that they are working towards a common goal, they must

  1. communicate in a timely manner,
  2. meet and discuss upcoming initiatives and projects,
  3. and discuss results along with future objectives.

In a perfect world, every team has the time and passion to accomplish these tasks to ensure the customer experience is in sync with their work. In reality, teams end up scrambling for information and understanding of how each business function is impacting the customer experience – sometimes after the CX program has already launched.

CX2

This process is extremely inefficient and can lead to serious problems across the customer experience. These problems can lead to irreparable financial losses. If business functions are not on the same page when launching an experience, it creates a broken one for customers. Siloed teams create siloed experiences.

There are plenty of companies that operate in a semi-siloed manner and feel it is successful. What these companies don’t understand is that customer experience issues often occur between the ownership of these silos, in what some refer to as the “customer experience abyss,” where no business function claims ownership. Customers react to these broken experiences by communicating their frustration through different communication channels (chats, surveys, reviews, calls, tweets, posts etc.).

For example, if a company launches a new subscription service and customers are confused about the pricing model, is it the job of customer service to explain it to customers?  What about those customers that don’t contact the business at all? Does marketing need to modify their campaigns? Maybe digital needs to edit the nomenclature online… It could be all of these things. The key is determining which will solve the poor customer experience.

The objective of a CX program is to focus deeply on what customers are saying and shift business teams to become advocates for what they say. Once advocacy is achieved, the customer experience can be improved at scale with speed and precision. A premium customer experience is the key to company growth and customer retention. How important is the customer experience?

You may be saying to yourself, “We already have teams examining our customer data, no
need to establish a new team to look at it.” While this may be true, the teams are likely taking a siloed approach to analyzing customer data by only investigating the portion of the data they own.

For example, the social team looks at social data, the digital team analyzes web feedback and analytics, the marketing team reviews surveys and performs studies, etc. Seldom do these teams come together and combine their data to get a holistic view of the customer. Furthermore, when it comes to prioritizing CX improvements, they do so based on an incomplete view of the customer.

Consolidating all customer data gives a unified view of your customers while lessening the workload and increasing the rate at which insights are generated. The experience customers have with marketing, digital, and customer service, all lead to different interactions. Breaking these interactions into different, separate components is the reason companies struggle with understanding the true customer experience and miss the big picture on how to improve it.

The CX team, once established, will be responsible for creating a unified view of the customer which will provide the company with an unbiased understanding of how customers feel about their experiences as well as their expectations of the industry. These insights will provide awareness, knowledge, and curiosity that will empower business functions to improve the end-to-end customer experience.

CX programs are disruptive. A successful CX program will uncover insights that align with current business objectives and some insights that don’t at all. So, what do you do when you run into that stone wall? How do you move forward when a business function refuses to adopt the voice of the customer? Call in back-up from an executive who understands the value of the voice of the customer and why it needs to be top-of mind for every function.

When creating a disruptive program like CX, an executive owner is needed to overcome business hurdles along the way. Ideally, this executive owner will support the program and promote it to the broader business functions. In order to scale and become more widely adopted, it is also helpful to have executive support when the program begins.

The best candidates for initial ownership are typically marketing, analytics or operations executives. Along with understanding the value a CX program can offer, they should also understand the business’ current data landscape and help provide access to these data sets. Once the CX team has access to all the available customer data, it will be able to aggregate all necessary interactions.

Executive sponsors will help dramatically in regard to CX program adoption and eventual scaling. Executive sponsors

  • can provide the funding to secure the initial success,
  • promote the program to ensure other business functions work closer to the program,
  • and remove roadblocks that may otherwise take weeks to get over.

Although an executive sponsor is not necessary, it can make your life exponentially easier while you build, launch, and execute your CX program. Your customers don’t always tell you what you want to hear, and that can be difficult for some business functions to handle. When this is the case, some business functions will try to discredit insights altogether if they don’t align with their goals.

Data grows exponentially every year, faster than any company can manage. In 2016, 90% of the world’s data had been created in the previous two years. 80% of that data was unstructured language. The hype of “Big Data” has passed and the focus is now on “Big Insights” – how to manage all the data and make it useful. A company should not be allocating resources to collecting more data through expensive surveys or market research – instead, they should be focused on doing a better job of listening and reacting to what customers are already saying, by unifying the voice of the customer with data that is already readily available.

It’s critical to identify all the available customer interactions and determine value and richness. Be sure to think about all forms of direct and indirect interactions customers have. This includes:

CX3

These channels are just a handful of the most popular avenues customers use to engage with brands. Your company may have more, less, or none of these. Regardless, the focus should be on aggregating as many as possible to create a holistic view of the customer. This does not mean only aggregating your phone calls and chats; this includes every channel where your customers talk with, at, or about your company. You can’t be selective when it comes to analyzing your customers by channel. All customers are important, and they may have different ways of communicating with you.

Imagine if someone only listened to their significant other in the two rooms where they spend the most time, say the family room and kitchen. They would probably have a good understanding of the overall conversations (similar to a company only reviewing calls, chats, and social). However, ignoring them in the dining room, bedroom, kids’ rooms, and backyard, would inevitably lead to serious communication problems.

It’s true that phone, chat, and social data is extremely rich, accessible, and popular, but that doesn’t mean you should ignore other customers. Every channel is important. Each is used by a different customer, in a different manner, and serves a different purpose, some providing more context than others.

You may find your most important customers aren’t always the loudest and may be interacting with you through an obscure channel you never thought about. You need every customer channel to fully understand their experience.

Click here to access Topbox’s detailed study

Mastering Financial Customer Data at Multinational Scale

Your Customer Data…Consolidated or Chaotic?

In an ideal world, you know your customers. You know

  • who they are,
  • what business they transact,
  • who they transact with,
  • and their relationships.

You use that information to

  • calculate risk,
  • prevent fraud,
  • uncover new business opportunities,
  • and comply with regulatory requirements.

The problem at most financial institutions is that customer data environments are highly chaotic. Customer data is stored in numerous systems across the company. Most, if not all of which, has evolved over time in siloed environments according to business function. Each system has its

  • own management team,
  • technology platform,
  • data models,
  • quality issues,
  • and access policies.

Tamr1

This chaos prevents the firms from fully achieving and maintaining a consolidated view of customers and their activity.

The Cost of Chaos

A chaotic customer data environment can be an expensive problem in a financial institution. Customer changes have to be implemented in multiple systems, with a high likelihood of error or inconsistency because of manual processes. Discrepancies with the data leads to inevitable remediation activities that are widespread, and costly.

Analyzing customer data within one global bank required three months to compile and validate its correctness. The chaos leads to either

  1. prohibitively high time and cost of data preparation or
  2. garbage-in, garbage-out analytics.

The result of customer data chaos is an incredibly high risk profile — operational, regulatory, and reputational.

Eliminating the Chaos 1.0

Many financial services companies attempt to eliminate this chaos and consolidate their customer data.

A common approach is to implement a master data management (MDM) system. Customer data from different source systems is centralized into one place where it can be harmonized. The output is a “golden record,” or master customer record.

A lambda architecture permits data to stream into the centralized store and be processed in realtime so that it is immediately mastered and ready for use. Batch processes run on the centralized store to perform periodic (daily, monthly, quarterly, etc.) calculations on the data.

First-generation MDM systems centralize customer data and unify it by writing ETL scripts and matching rules.

Tamr2

The harmonizing often involves:

  1. Defining a common, master schema in which to store the consolidated data
  2. Writing ETL scripts to transform the data from source formats and schemas into the new common storage format
  3. Defining rule sets to deduplicate, match/cluster, and otherwise cleanse within the central MDM store

There are a number of commercial MDM solutions available that support the deterministic approach outlined above. The initial experience with those MDM systems, integrating the first five or so large systems, is often positive. Scaling MDM to master more and more systems, however, becomes a challenge that grows exponentially, as we’ll explain below.

Rules-based MDM, and the Robustness- Versus-Expandability Trade Off

The rule sets used to harmonize data together are usually driven off of a handful of dependent attributes—name, legal identifiers, location, and so on. Let’s say you use six attributes to stitch together four systems, A and B, and then the same six attributes between A and C, then A and D, B and C, B and D, and C and D. Within that example of 4 systems, you would have twenty four potential attributes that you are aligning. Add a fifth system, it’s 60 attributes; a sixth system, 90 attributes. So the effort to master additional systems grows exponentially. And in most multinational financial institutions, the number of synchronized attributes is not six; it’s commonly 50 to 100.

And maintenance is equally burdensome. There’s no guarantee that your six attributes maintain their validity or veracity over time. If any of these attributes need to be modified, then rules need to be redefined across the systems all over again.

The trade off for many financial institutions is robustness versus expandability. In other words, you can have a large-scale data mastering implementation and have it wildly complex, or you can do something small and have it highly accurate.

This is problematic for most financial institutions, which have very large-scale customer data challenges.

Customer Data Mastering at Scale

In larger financial services companies, especially multinationals, the number of systems in which customer data resides is much larger than the examples above. It is not uncommon to see financial companies with over 100 large systems.

Among those are systems that have been:

  • Duplicated in many countries to comply with data sovereignty regulations
  • Acquired via inorganic growth, purchased companies bringing in their own infrastructure for trading, CRM, HR, and back office. Integrating these can take a significant amount of time and cost

tamr3

When attempting to master a hundred sources containing petabytes of data, all of which have data linking and matching in different ways across a multitude of attributes and systems, you can see that the matching rules required to harmonize your data together gets incredibly complex.

Every incremental source added to the MDM environment can take thousands of rules to be implemented. Within just a mere handful of systems, the complexity gets to a point where it’s unattainable. As that complexity goes up, the cost of maintaining a rules-based approach also scales wildly, requiring more and more data stewards to make sure all the stitching rules remain correct.

Mastering data at scale is one of the riskiest endeavors a business can take. Gartner reports that 85% of MDM projects fail. And MDM budgets of $10M to $20M per year are not uncommon in large multinationals. With such high stakes, making sure that you get the right approach is critical to making sure that this thing is a success.

A New Take on an Old Paradigm

What follows is a reference architecture. The approach daisy chains together three large tool sets, each with appropriate access policies enforced, that are responsible for three separate steps in the mastering process:

  1. Raw Data Zone
  2. Common Data Zone
  3. Mastered Data Zone

tamr4

Raw Data Zone The first sits on a traditional data lake model—a landing area for raw data. Data is replicated from source systems to the centralized data repository (often built on Hadoop). Data is replicated in real time (perhaps via Kafka) wherever possible so that data is most up to date. For source systems that do not support real-time replication, nightly batch jobs or flat-file ingestion are used.

Common Data Zone Within the Common Data Zone, we take all of the data from the Raw Zone—with the various different objects, in different shapes and sizes, and conform that into outputs that look and feel the same to the system, with the same column headers, data types, and formats.

The toolset in this zone utilizes machine learning models to categorize data that exists within the Raw Data Zone. Machine learning models are trained on what certain attributes look like—what’s a legal entity, or a registered address, or country of incorporation, or legal hierarchy, or any other field. It does so without requiring anyone having to go back to the source system owners to bog them down with questions about that, saving weeks of effort.

This solution builds up a taxonomy and schema for the conformed data as raw data is processed. Unlike early-generation MDM solutions, this substantially reduces data unification time, often by months per source system, because there is:

  • No need to pre-define a schema to hold conformed data
  • No need to write ETL to transform the raw data

One multinational bank implementing this reference architecture reported being able to conform the raw data from a 10,000-table system within three days, and without using up source systems experts’ time defining a schema or writing ETL code. In terms of figuring out where relevant data is located in the vast wilderness this solution is very productive and predictable.

Mastered Data Zone In the third zone, the conformed data is mastered, and the outputs of the mastering process are clusters of records that refer to the same real-world entity. Within each cluster, a single, unified golden, master record of the entity is configured. The golden customer record is then distributed to wherever it’s needed:

  • Data warehouses
  • Regulatory (KYC, AML) compliance systems
  • Fraud and corruption monitoring
  • And back to operational systems, to keep data changes clean at the source

As with the Common Zone, machine learning models are used. These models eliminate the need to define hundreds of rules to match and deduplicate data. Tamr’s solution applies a probabilistic model that uses statistical analysis and naive Bayesian modeling to learn from existing relationships between various attributes, and then makes record-matching predictions based on these attribute relationships.

Tamr matching models require training, which usually takes just a few days per source system. Tamr presents a data steward with its predictions, and the steward can either confirm or deny them to help Tamr perfect its matching.

With the probabilistic model, Tamr looks at all of the attributes on which it has been trained, and based on the attribute matching, the solution will indicate a confidence level of a match being accurate. Depending on a configurable confidence level threshold, It will disregard entries that fall below the threshold from further analysis and training.

As you train Tamr and correct it, it becomes more accurate over time. The more data you throw at te solution, the better it gets. Which is a stark contrast to the rules-based MDM approach, where the more data you throw at it, it tends to break because the rules can’t keep up with the level of complexity.

Distribution A messaging bus (e.g., Apache Kafka) is often used to distribute mastered customer data throughout the organization. If a source system wants to pick up the master copy from the platform, it subscribes to that topic on the messaging bus to receive the feed of changes.

Another approach is to pipeline deltas from the MDM platform into target system in batch.

Real-world Results

This data mastering architecture is in production at a number of large financial institutions. Compared with traditional MDM approaches, the model-driven approach provides the following advantages:

70% fewer IT resources required:

  • Humans in the entity resolution loop are much more productive, focused on a relatively small percentage (~5%) of exceptions that the machine learning algorithms cannot resolve
  • Eliminates ETL and matching rules development
  • Reduces manual data synchronization and remediation of customer data across systems

Faster customer data unification:

  • A global retail bank mastered 35 large IT systems within 6 months—about 4 days per source system
  • New data is mastered within 24 hours of landing in the Raw Data Zone
  • A platform for mastering any category of data—customer, product, suppler, and others

Faster, more complete achievement of data-driven business initiatives:

  • KYC, AML, fraud detection, risk analysis, and others.


Click here to access Tamr’s detailed analysistamr4

Building your data and analytics strategy

When it comes to being data-driven, organizations run the gamut with maturity levels. Most believe that data and analytics provide insights. But only one-third of respondents to a TDWI survey said they were truly data-driven, meaning they analyze data to drive decisions and actions.

Successful data-driven businesses foster a collaborative, goal-oriented culture. Leaders believe in data and are governance-oriented. The technology side of the business ensures sound data quality and puts analytics into operation. The data management strategy spans the full analytics life cycle. Data is accessible and usable by multiple people – data engineers and data scientists, business analysts and less-technical business users.

TDWI analyst Fern Halper conducted research of analytics and data professionals across industries and identified the following five best practices for becoming a data-driven organization.

1. Build relationships to support collaboration

If IT and business teams don’t collaborate, the organization can’t operate in a data-driven way – so eliminating barriers between groups is crucial. Achieving this can improve market performance and innovation; but collaboration is challenging. Business decision makers often don’t think IT understands the importance of fast results, and conversely, IT doesn’t think the business understands data management priorities. Office politics come into play.

But having clearly defined roles and responsibilities with shared goals across departments encourages teamwork. These roles should include: IT/architecture, business and others who manage various tasks on the business and IT sides (from business sponsors to DevOps).

2. Make data accessible and trustworthy

Making data accessible – and ensuring its quality – are key to breaking down barriers and becoming data-driven. Whether it’s a data engineer assembling and transforming data for analysis or a data scientist building a model, everyone benefits from trustworthy data that’s unified and built around a common vocabulary.

As organizations analyze new forms of data – text, sensor, image and streaming – they’ll need to do so across multiple platforms like data warehouses, Hadoop, streaming platforms and data lakes. Such systems may reside on-site or in the cloud. TDWI recommends several best practices to help:

  • Establish a data integration and pipeline environment with tools that provide federated access and join data across sources. It helps to have point-and-click interfaces for building workflows, and tools that support ETL, ELT and advanced specifications like conditional logic or parallel jobs.
  • Manage, reuse and govern metadata – that is, the data about your data. This includes size, author, database column structure, security and more.
  • Provide reusable data quality tools with built-in analytics capabilities that can profile data for accuracy, completeness and ambiguity.

3. Provide tools to help the business work with data

From marketing and finance to operations and HR, business teams need self-service tools to speed and simplify data preparation and analytics tasks. Such tools may include built-in, advanced techniques like machine learning, and many work across the analytics life cycle – from data collection and profiling to monitoring analytical models in production.

These “smart” tools feature three capabilities:

  • Automation helps during model building and model management processes. Data preparation tools often use machine learning and natural language processing to understand semantics and accelerate data matching.
  • Reusability pulls from what has already been created for data management and analytics. For example, a source-to-target data pipeline workflow can be saved and embedded into an analytics workflow to create a predictive model.
  • Explainability helps business users understand the output when, for example, they’ve built a predictive model using an automated tool. Tools that explain what they’ve done are ideal for a data-driven company.

4. Consider a cohesive platform that supports collaboration and analytics

As organizations mature analytically, it’s important for their platform to support multiple roles in a common interface with a unified data infrastructure. This strengthens collaboration and makes it easier for people to do their jobs.

For example, a business analyst can use a discussion space to collaborate with a data scientist while building a predictive model, and during testing. The data scientist can use a notebook environment to test and validate the model as it’s versioned and metadata is captured. The data scientist can then notify the DevOps team when the model is ready for production – and they can use the platform’s tools to continually monitor the model.

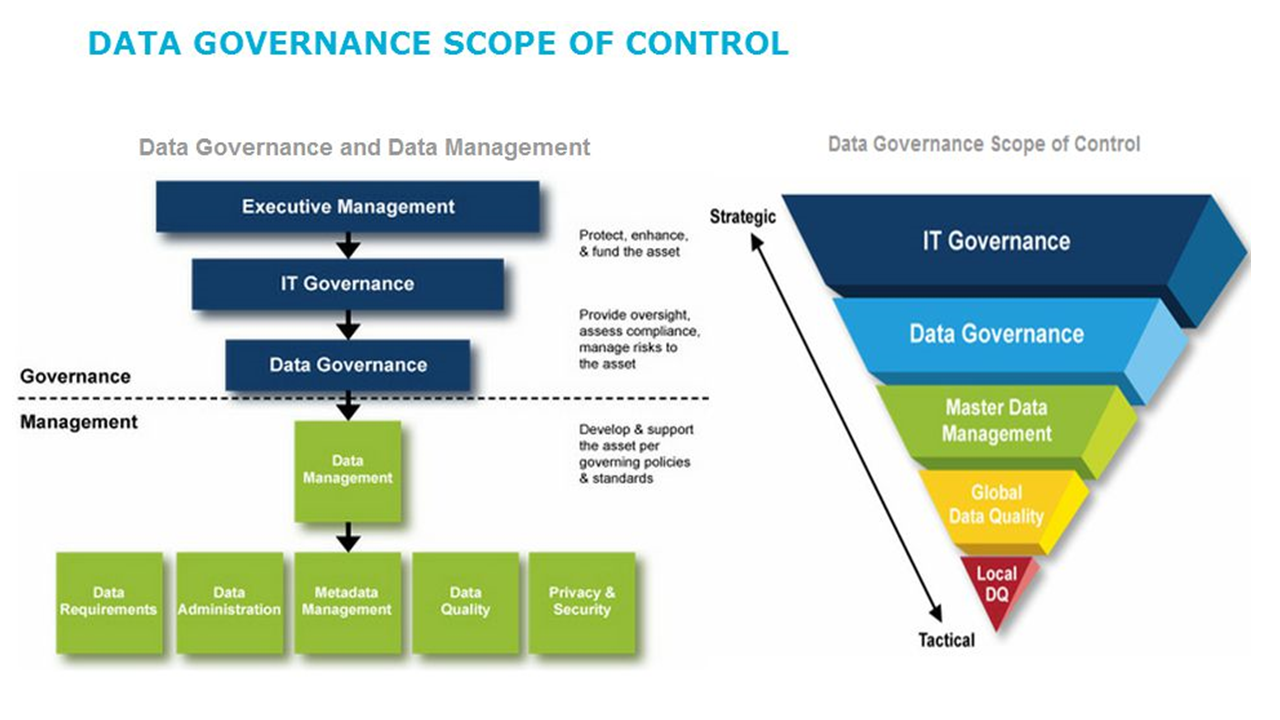
5. Use modern governance technologies and practices

Governance – that is, rules and policies that prescribe how organizations protect and manage their data and analytics – is critical in learning to trust data and become data-driven. But TDWI research indicates that one-third of organizations don’t govern their data at all. Instead, many focus on security and privacy rules. Their research also indicates that fewer than 20 percent of organizations do any type of analytics governance, which includes vetting and monitoring models in production.

Decisions based on poor data – or models that have degraded – can have a negative effect on the business. As more people across an organization access data and build  models, and as new types of data and technologies emerge (big data, cloud, stream mining), data governance practices need to evolve. TDWI recommends three features of governance software that can strengthen your data and analytics governance:

  • Data catalogs, glossaries and dictionaries. These tools often include sophisticated tagging and automated procedures for building and keeping catalogs up to date – as well as discovering metadata from existing data sets.
  • Data lineage. Data lineage combined with metadata helps organizations understand where data originated and track how it was changed and transformed.
  • Model management. Ongoing model tracking is crucial for analytics governance. Many tools automate model monitoring, schedule updates to keep models current and send alerts when a model is degrading.

In the future, organizations may move beyond traditional governance council models to new approaches like agile governance, embedded governance or crowdsourced governance.

But involving both IT and business stakeholders in the decision-making process – including data owners, data stewards and others – will always be key to robust governance at data-driven organizations.

SAS1

There’s no single blueprint for beginning a data analytics project – never mind ensuring a successful one.

However, the following questions help individuals and organizations frame their data analytics projects in instructive ways. Put differently, think of these questions as more of a guide than a comprehensive how-to list.

1. Is this your organization’s first attempt at a data analytics project?

When it comes to data analytics projects, culture matters. Consider Netflix, Google and Amazon. All things being equal, organizations like these have successfully completed data analytics projects. Even better, they have built analytics into their cultures and become data-driven businesses.

As a result, they will do better than neophytes. Fortunately, first-timers are not destined for failure. They should just temper their expectations.

2. What business problem do you think you’re trying to solve?

This might seem obvious, but plenty of folks fail to ask it before jumping in. Note here how I qualified the first question with “do you think.” Sometimes the root cause of a problem isn’t what we believe it to be; in other words, it’s often not what we at first think.

In any case, you don’t need to solve the entire problem all at once by trying to boil the ocean. In fact, you shouldn’t take this approach. Project methodologies (like agile) allow organizations to take an iterative approach and embrace the power of small batches.

3. What types and sources of data are available to you?

Most if not all organizations store vast amounts of enterprise data. Looking at internal databases and data sources makes sense. Don’t make the mistake of believing, though, that the discussion ends there.

External data sources in the form of open data sets (such as data.gov) continue to proliferate. There are easy methods for retrieving data from the web and getting it back in a usable format – scraping, for example. This tactic can work well in academic environments, but scraping could be a sign of data immaturity for businesses. It’s always best to get your hands on the original data source when possible.

Caveat: Just because the organization stores it doesn’t mean you’ll be able to easily access it. Pernicious internal politics stifle many an analytics endeavor.

4. What types and sources of data are you allowed to use?

With all the hubbub over privacy and security these days, foolish is the soul who fails to ask this question. As some retail executives have learned in recent years, a company can abide by the law completely and still make people feel decidedly icky about the privacy of their purchases. Or, consider a health care organization – it may not technically violate the Health Insurance Portability and Accountability Act of 1996 (HIPAA), yet it could still raise privacy concerns.

Another example is the GDPR. Adhering to this regulation means that organizations won’t necessarily be able to use personal data they previously could use – at least not in the same way.

5. What is the quality of your organization’s data?

Common mistakes here include assuming your data is complete, accurate and unique (read: nonduplicate). During my consulting career, I could count on one hand the number of times a client handed me a “perfect” data set. While it’s important to cleanse your data, you don’t need pristine data just to get started. As Voltaire said, “Perfect is the enemy of good.”

6. What tools are available to extract, clean, analyze and present the data?

This isn’t the 1990s, so please don’t tell me that your analytic efforts are limited to spreadsheets. Sure, Microsoft Excel works with structured data – if the data set isn’t all that big. Make no mistake, though: Everyone’s favorite spreadsheet program suffers from plenty of limitations, in areas like:

  • Handling semistructured and unstructured data.
  • Tracking changes/version control.
  • Dealing with size restrictions.
  • Ensuring governance.
  • Providing security.

For now, suffice it to say that if you’re trying to analyze large, complex data sets, there are many tools well worth exploring. The same holds true for visualization. Never before have we seen such an array of powerful, affordable and user-friendly tools designed to present data in interesting ways.

Caveat 1: While software vendors often ape each other’s features, don’t assume that each application can do everything that the others can.

Caveat 2: With open source software, remember that “free” software could be compared to a “free” puppy. To be direct: Even with open source software, expect to spend some time and effort on training and education.

7. Do your employees possess the right skills to work on the data analytics project?

The database administrator may well be a whiz at SQL. That doesn’t mean, though, that she can easily analyze gigabytes of unstructured data. Many of my students need to learn new programs over the course of the semester, and the same holds true for employees. In fact, organizations often find that they need to:

  • Provide training for existing employees.
  • Hire new employees.
  • Contract consultants.
  • Post the project on sites such as Kaggle.
  • All of the above.

Don’t assume that your employees can pick up new applications and frameworks 15 minutes at a time every other week. They can’t.

8. What will be done with the results of your analysis?

A company routinely spent millions of dollars recruiting MBAs at Ivy League schools only to see them leave within two years. Rutgers MBAs, for their part, stayed much longer and performed much better.

Despite my findings, the company continued to press on. It refused to stop going to Harvard, Cornell, etc. because of vanity. In his own words, the head of recruiting just “liked” going to these schools, data be damned.

Food for thought: What will an individual, group, department or organization do with keen new insights from your data analytics projects? Will the result be real action? Or will a report just sit in someone’s inbox?

9. What types of resistance can you expect?

You might think that people always and willingly embrace the results of data-oriented analysis. And you’d be spectacularly wrong.

Case in point: Major League Baseball (MLB) umpires get close ball and strike calls wrong more often than you’d think. Why wouldn’t they want to improve their performance when presented with objective data? It turns out that many don’t. In some cases, human nature makes people want to reject data and analytics that contrast with their world views. Years ago, before the subscription model became wildly popular, some Blockbuster executives didn’t want to believe that more convenient ways to watch movies existed.

Caveat: Ignore the power of internal resistance at your own peril.

10. What are the costs of inaction?

Sure, this is a high-level query and the answers depend on myriad factors.

For instance, a pharma company with years of patent protection will respond differently than a startup with a novel idea and competitors nipping at its heels. Interesting subquestions here include:

  • Do the data analytics projects merely confirm what we already know?
  • Do the numbers show anything conclusive?
  • Could we be capturing false positives and false negatives?

Think about these questions before undertaking data analytics projects Don’t take the queries above as gospel. By and large, though, experience proves that asking these questions frames the problem well and sets the organization up for success – or at least minimizes the chance of a disaster.

SAS2

Most organizations understand the importance of data governance in concept. But they may not realize all the multifaceted, positive impacts of applying good governance practices to data across the organization. For example, ensuring that your sales and marketing analytics relies on measurably trustworthy customer data can lead to increased revenue and shorter sales cycles. And having a solid governance program to ensure your enterprise data meets regulatory requirements could help you avoid penalties.

Companies that start data governance programs are motivated by a variety of factors, internal and external. Regardless of the reasons, two common themes underlie most data governance activities: the desire for high-quality customer information, and the need to adhere to requirements for protecting and securing that data.

What’s the best way to ensure you have accurate customer data that meets stringent requirements for privacy and security?

For obvious reasons, companies exert significant effort using tools and third-party data sets to enforce the consistency and accuracy of customer data. But there will always be situations in which the managed data set cannot be adequately synchronized and made consistent with “real-world” data. Even strictly defined and enforced internal data policies can’t prevent inaccuracies from creeping into the environment.

sas3

Why you should move beyond a conventional approach to data governance?

When it comes to customer data, the most accurate sources for validation are the customers themselves! In essence, every customer owns his or her information, and is the most reliable authority for ensuring its quality, consistency and currency. So why not develop policies and methods that empower the actual owners to be accountable for their data?

Doing this means extending the concept of data governance to the customers and defining data policies that engage them to take an active role in overseeing their own data quality. The starting point for this process fits within the data governance framework – define the policies for customer data validation.

A good template for formulating those policies can be adapted from existing regulations regarding data protection. This approach will assure customers that your organization is serious about protecting their data’s security and integrity, and it will encourage them to actively participate in that effort.

Examples of customer data engagement policies

  • Data protection defines the levels of protection the organization will use to protect the customer’s data, as well as what responsibilities the organization will assume in the event of a breach. The protection will be enforced in relation to the customer’s selected preferences (which presumes that customers have reviewed and approved their profiles).
  • Data access control and security define the protocols used to control access to customer data and the criteria for authenticating users and authorizing them for particular uses.
  • Data use describes the ways the organization will use customer data.
  • Customer opt-in describes the customers’ options for setting up the ways the organization can use their data.
  • Customer data review asserts that customers have the right to review their data profiles and to verify the integrity, consistency and currency of their data. The policy also specifies the time frame in which customers are expected to do this.
  • Customer data update describes how customers can alert the organization to changes in their data profiles. It allows customers to ensure their data’s validity, integrity, consistency and currency.
  • Right-to-use defines the organization’s right to use the data as described in the data use policy (and based on the customer’s selected profile options). This policy may also set a time frame associated with the right-to-use based on the elapsed time since the customer’s last date of profile verification.

The goal of such policies is to establish an agreement between the customer and the organization that basically says the organization will protect the customer’s data and only use it in ways the customer has authorized – in return for the customer ensuring the data’s accuracy and specifying preferences for its use. This model empowers customers to take ownership of their data profile and assume responsibility for its quality.

Clearly articulating each party’s responsibilities for data stewardship benefits both the organization and the customer by ensuring that customer data is high-quality and properly maintained. Better yet, recognize that the value goes beyond improved revenues or better compliance.

Empowering customers to take control and ownership of their data just might be enough to motivate self-validation.

Click her to access SAS’ detailed analysis

From Risk to Strategy : Embracing the Technology Shift

The role of the risk manager has always been to understand and manage threats to a given business. In theory, this involves a very broad mandate to capture all possible risks, both current and future. In practice, however, some risk managers are assigned to narrower, siloed roles, with tasks that can seem somewhat disconnected from key business objectives.

Amidst a changing risk landscape and increasing availability of technological tools that enable risk managers to do more, there is both a need and an opportunity to move toward that broader risk manager role. This need for change – not only in the risk manager’s role, but also in the broader approach to organizational risk management and technological change – is driven by five factors.

Marsh Ex 1

The rapid pace of change has many C-suite members questioning what will happen to their business models. Research shows that 73 percent of executives predict significant industry disruption in the next three years (up from 26 percent in 2018). In this challenging environment, risk managers have a great opportunity to demonstrate their relevance.

USING NEW TOOLS TO MANAGE RISKS

Emerging technologies present compelling opportunities for the field of risk management. As discussed in our 2017 report, the three levers of data, analytics, and processes allow risk professionals a framework to consider technology initiatives and their potential gains. Emerging tools can support risk managers in delivering a more dynamic, in-depth view of risks in addition to potential cost-savings.

However, this year’s survey shows that across Asia-Pacific, risk managers still feel they are severely lacking knowledge of emerging technologies across the business. Confidence scores were low in all but one category, risk management information systems (RMIS). These scores were only marginally higher for respondents in highly regulated industries (financial services and energy utilities), underscoring the need for further training across all industries.

Marsh Ex 3

When it comes to technology, risk managers should aim for “digital fluency, a level of familiarity that allows them to

  • first determine how technologies can help address different risk areas,
  • and then understand the implications of doing so.

They need not understand the inner workings of various technologies, as their niche should remain aligned with their core expertise: applying risk technical skills, principles, and practices.

CULTIVATING A “DIGITAL-FIRST” MIND-SET

Successful technology adoption does not only present a technical skills challenge. If risk function digitalization is to be effective, risk managers must champion a cultural shift to a “digital-first” mindset across the organization, where all stakeholders develop a habit of thinking about how technology can be used for organizational benefit.

For example, the risk manager of the future will be looking to glean greater insights using increasingly advanced analytics capabilities. To do this, they will need to actively encourage their organization

  • to collect more data,
  • to use their data more effectively,
  • and to conduct more accurate and comprehensive analyses.

Underlying the risk manager’s digitalfirst mind-set will be three supporting mentalities:

1. The first of these is the perception of technology as an opportunity rather than a threat. Some understandable anxiety exists on this topic, since technology vendors often portray technology as a means of eliminating human input and labor. This framing neglects the gains in effectiveness and efficiency that allow risk managers to improve their judgment and decision making, and spend their time on more value-adding activities. In addition, the success of digital risk transformations will depend on the risk professionals who understand the tasks being digitalized; these professionals will need to be brought into the design and implementation process right from the start. After all, as the Japanese saying goes, “it is workers who give wisdom to the machines.” Fortunately, 87 percent of PARIMA surveyed members indicated that automating parts of the risk manager’s job to allow greater efficiency represents an opportunity for the risk function. Furthermore, 63 percent of respondents indicated that this was not merely a small opportunity, but a significant one (Exhibit 6). This positive outlook makes an even stronger statement than findings from an earlier global study in which 72 percent of employees said they see technology as a benefit to their work

2. The second supporting mentality will be a habit of looking for ways in which technology can be used for benefit across the organization, not just within the risk function but also in business processes and client solutions. Concretely, the risk manager can embody this culture by adopting a data-driven approach, whereby they consider:

  • How existing organizational data sources can be better leveraged for risk management
  • How new data sources – both internal and external – can be explored
  • How data accuracy and completeness can be improved

“Risk managers can also benefit from considering outside-the-box use cases, as well as keeping up with the technologies used by competitors,” adds Keith Xia, Chief Risk Officer of OneHealth Healthcare in China.

This is an illustrative rather than comprehensive list, as a data-driven approach – and more broadly, a digital mind-set – is fundamentally about a new way of thinking. If risk managers can grow accustomed to reflecting on technologies’ potential applications, they will be able to pre-emptively spot opportunities, as well as identify and resolve issues such as data gaps.

3. All of this will be complemented by a third mentality: the willingness to accept change, experiment, and learn, such as in testing new data collection and analysis methods. Propelled by cultural transformation and shifting mind-sets, risk managers will need to learn to feel comfortable with – and ultimately be in the driver’s seat for – the trial, error, and adjustment that accompanies digitalization.

MANAGING THE NEW RISKS FROM EMERGING TECHNOLOGIES

The same technological developments and tools that are enabling organizations to transform and advance are also introducing their own set of potential threats.

Our survey shows the PARIMA community is aware of this dynamic, with 96 percent of surveyed members expecting that emerging technologies will introduce some – if not substantial – new risks in the next five years.

The following exhibit gives a further breakdown of views from this 96 percent of respondents, and the perceived sufficiency of their existing frameworks. These risks are evolving in an environment where there are already questions about the relevance and sufficiency of risk identification frameworks. Risk management has become more challenging due to the added complexity from rapid shifts in technology, and individual teams are using risk taxonomies with inconsistent methodologies, which further highlight the challenges that risk managers face in managing their responses to new risk types.

Marsh Ex 9

To assess how new technology in any part of the organization might introduce new risks, consider the following checklist :

HIGH-LEVEL RISK CHECKLIST FOR EMERGING TECHNOLOGY

  1. Does the use of this technology cut across existing risk types (for example, AI risk presents a composite of technology risk, cyber risk, information security risk, and so on depending on the use case and application)? If so, has my organization designated this risk as a new, distinct category of risk with a clear definition and risk appetite?
  2. Is use of this technology aligned to my company’s strategic ambitions and risk appetite ? Are the cost and ease of implementation feasible given my company’s circumstances?
  3. Can this technology’s implications be sufficiently explained and understood within my company (e.g. what systems would rely on it)? Would our use of this technology make sense to a customer?
  4. Is there a clear view of how this technology will be supported and maintained internally, for example, with a digitally fluent workforce and designated second line owner for risks introduced by this technology (e.g. additional cyber risk)?
  5. Has my company considered the business continuity risks associated with this technology malfunctioning?
  6. Am I confident that there are minimal data quality or management risks? Do I have the high quality, large-scale data necessary for advanced analytics? Would customers perceive use of their data as reasonable, and will this data remain private, complete, and safe from cyberattacks?
  7. Am I aware of any potential knock-on effects or reputational risks – for example, through exposure to third (and fourth) parties that may not act in adherence to my values, or through invasive uses of private customer information?
  8. Does my organization understand all implications for accounting, tax, and any other financial reporting obligations?
  9. Are there any additional compliance or regulatory implications of using this technology? Do I need to engage with regulators or seek expert advice?
  10. For financial services companies: Could I explain any algorithms in use to a customer, and would they perceive them to be fair? Am I confident that this technology will not violate sanctions or support crime (for example, fraud, money laundering, terrorism finance)?

SECURING A MORE TECHNOLOGY-CONVERSANT RISK WORKFORCE

As risk managers focus on digitalizing their function, it is important that organizations support this with an equally deliberate approach to their people strategy. This is for two reasons, as Kate Bravery, Global Solutions Leader, Career at Mercer, explains: “First, each technological leap requires an equivalent revolution in talent; and second, talent typically becomes more important following disruption.”

While upskilling the current workforce is a positive step, as addressed before, organizations must also consider a more holistic talent management approach. Risk managers understand this imperative, with survey respondents indicating a strong desire to increase technology expertise in their function within the next five years.

Yet, little progress has been made in adding these skills to the risk function, with a significant gap persisting between aspirations and the reality on the ground. In both 2017 and 2019 surveys, the number of risk managers hoping to recruit technology experts has been at least 4.5 times the number of teams currently possessing those skills.

Marsh Ex 15

EMBEDDING RISK CULTURE THROUGHOUT THE ORGANIZATION

Our survey found that a lack of risk management thinking in other parts of the organization is the biggest barrier the risk function faces in working with other business units. This is a crucial and somewhat alarming finding – but new technologies may be able to help.

Marsh Ex 19

As technology allows for increasingly accurate, relevant, and holistic risk measures, organizations should find it easier to develop risk-based KPIs and incentives that can help employees throughout the business incorporate a risk-aware approach into their daily activities.

From an organizational perspective, a first step would be to describe risk limits and risk tolerance in a language that all stakeholders can relate to, such as potential losses. Organizations can then cascade these firm-wide risk concepts down to operational business units, translating risk language into tangible and relevant incentives that encourages behavior that is consistent with firm values. Research shows that employees in Asia want this linkage, citing a desire to better align their individual goals with business goals.

The question thus becomes how risk processes can be made an easy, intuitive part of employee routines. It is also important to consider KPIs for the risk team itself as a way of encouraging desirable behavior and further embedding a risk-aware culture. Already a majority of surveyed PARIMA members use some form of KPIs in their teams (81 percent), and the fact that reporting performance is the most popular service level measure supports the expectation that PARIMA members actively keep their organization informed.

Marsh Ex 21

At the same time, these survey responses also raise a number of questions. Forty percent of organizations indicate that they measure reporting performance, but far fewer are measuring accuracy (15 percent) or timeliness (16 percent) of risk analytics – which are necessary to achieve improved reporting performance. Moreover, the most-utilized KPIs in this year’s survey tended to be tangible measures around cost, from which it can be difficult to distinguish a mature risk function from a lucky one.

SUPPORTING TRANSFORMATIONAL CHANGE PROGRAMS

Even with a desire from individual risk managers to digitalize and complement organizational intentions, barriers still exist that can leave risk managers using basic tools. In 2017, cost and budgeting concerns were the single, standout barrier to risk function digitalization, chosen by 67 percent of respondents, well clear of second placed human capital concerns at 18 percent. This year’s survey responses were much closer, with a host of ongoing barriers, six of which were cited by more than 40 percent of respondents.

Marsh Ex 22

Implementing the nuts and bolts of digitalization will require a holistic transformation program to address all these barriers. That is not to say that initiatives must necessarily be massive in scale. In fact, well-designed initiatives targeting specific business problems can be a great way to demonstrate success that can then be replicated elsewhere to boost innovation.

Transformational change is inherently difficult, in particular where it spans both technological as well as people dimensions. Many large organizations have generally relied solely on IT teams for their “digital transformation” initiatives. This approach has had limited success, as such teams are usually designed to deliver very specific business functionalities, as opposed to leading change initiatives. If risk managers are to realize the benefits of such transformation, it is incumbent on them to take a more active role in influencing and leading transformation programs.

Click here to access Marsh’s and Parima’s detailed report

The Future of CFO’s Business Partnering

BP² – the next generation of Business Partner

The role of business partner has become almost ubiquitous in organizations today. According to respondents of this survey, 88% of senior finance professionals already consider themselves to be business partners. This key finding suggests that the silo mentality is breaking down and, at last, departments and functions are joining forces to teach and learn from each other to deliver better performance. But the scope of the role, how it is defined, and how senior finance executives characterize their own business partnering are all open to interpretation. And many of the ideas are still hamstrung by traditional finance behaviors and aspirations, so that the next generation of business partners as agents of change and innovation languish at the bottom of the priority list.

The scope of business partnering

According to the survey, most CFOs see business partnering as a blend of traditional finance and commercial support, while innovation and change are more likely to be seen as outside the scope of business partnering. 57% of senior finance executives strongly agree that a business partner should challenge budgets, plans and forecasts. Being involved in strategy and development followed closely behind with 56% strongly agreeing that it forms part of the scope of business partnering, while influencing commercial decisions was a close third.

The pattern that emerges from the survey is that traditional and commercial elements are given more weight within the scope of business partnering than being a catalyst for change and innovation. This more radical change agenda is only shared by around 36% of respondents, indicating that finance professionals still largely see their role in traditional or commercial terms. They have yet to recognize the finance function’s role in the next generation of business partnering, which can be

  • the catalyst for innovation in business models,
  • for process improvements
  • and for organizational change.

Traditional and commercial business partners aren’t necessarily less important than change agents, but the latter has the potential to add the most value in the longer term, and should at least be in the purview of progressive CFOs who want to drive change and encourage growth.

Unfortunately, this is not an easy thing to change. Finding time for any business partnering can be a struggle, but CFOs spend disproportionately less time on activities that bring about change than on traditional business partnering roles. Without investing time and effort into it, CFOs will struggle to fulfill their role as the next generation of business partner.

Overall 45% of CFOs struggle to make time for any business partnering, so it won’t come as a surprise that, ultimately, only 57% of CFOs believe their finance team efforts as business partners are well regarded by the operational functions.

The four personas of business partnering

Ask a room full of CFOs what business partnering means and you’ll get a room full of answers, each one influenced by their personal journey through the changing business landscape. By its very variability, this important business process is being enacted in many ways. FSN, the survey authors, did not seek to define business partnering. Instead, the survey asked respondents to define business partnering in their own words, and the 366 detailed answers were all different. But underlying the diversity were patterns of emphasis that defined four ‘personas’ or styles of business partnering, each exerting its own influence on the growth of the business over time.

A detailed analysis of the definitions and the frequency of occurrence of key phrases and expressions allowed us to plot these personas, their relative weight, together with their likely impact on growth over time.

FSN1

The size of the bubbles denotes the frequency (number) of times an attribute of business partnering was referenced in the definitions and these were plotted in terms of their likely contribution to growth in the short to long term.

The greatest number of comments by far coalesced around the bottom left-hand quadrant denoting a finance-centric focus on short to medium term outcomes, i.e., the traditional finance business partner. But there was an encouraging drift upwards and rightwards towards the quadrant denoting what we call the next generation of business partner, “BP²” (BP Squared), a super-charged business partner using his or her wide experience, purview and remit to help bring about change in the organization, for example, new business models, new processes and innovative methods of organizational deployment.

Relatively few of the 383 business partners offering definitions of a business partner, concerned themselves with top line growth i.e. with involvement in commercial sales negotiations or the sales pipeline – a critical part of influencing growth.

Finally, surprisingly few finance business partners immersed themselves in strategy development or saw their role as helping to ensure strategic alignment. It suggests that the ongoing transition of the CFO’s role from financial steward to strategic advisor is not as advanced as some would suggest.

Financial Performance Drivers

Most CFOs and senior finance executives define the role of the business partner in traditional financial terms. They are there to explain and illuminate the financial operations, be a trusted, safe pair of hands that manages business risk, and provide s ome operational support. The focus for these CFOs is on communicating a clear understanding of the financial imperative in order to steer the performance of the business prudently.

This ideal reflects the status quo and perpetuates the traditional view of finance, and the role of the CFO. It’s one where the finance function remains a static force, opening up only so far as to allow the rest of the business to see how it functions and make them more accountable to it. While it is obviously necessary for other functions to understand and support a financial strategy, the drawback of this approach is the shortcomings for the business as a whole. Finance-centric business partnering provides some short-term outcomes but does little to promote more than pedestrian growth. It’s better than nothing, but it’s far from the best.

Top-Line Drivers

In the upper quadrant, top line drivers focus on driving growth and sales with a collaborative approach to commercial decision-making. This style of business partnering can have a positive effect on earnings, as improvements in commercial operations and the management of the sales pipeline are translated into revenue.

But while top line drivers are linked to higher growth than financial-focused business partners, the outcome tends to be only short term. The key issue for CFOs is that very few of them even allude to commercial partnerships when defining the scope of business partnering. They ignore the potential for the finance function to help improve the commercial outcomes, like sales or the collection of debt or even a change in business models.

Strategic Aligners

Those CFOs who focus on strategic alignment in their business partnering approach tend to see longer term results. They use analysis and strategy to drive decisionmaking, bringing business goals into focus through partnerships and collaborative working. This business benefit helps to strengthen the foundation of the business in the long term, but it isn’t the most effective in driving substantial growth. And again, there is a paucity of CFOs and senior finance executives who cited strategy development and analysis in their definition of business partnering.

Catalysts for change

The CFOs who were the most progressive and visionary in their definition of business partnering use the role as a catalyst for change. They challenge their colleagues, influence the strategic direction of the business, and generate momentum through change and innovation from the very heart of the finance function. These finance executives get involved in decision-making, and understand the need to influence, advise and challenge in order to promote change. This definition is the one that translates into sustained high growth.

The four personas are not mutually exclusive. Some CFOs view business partnering as a combination of some or all of these attributes. But the preponderance of opinion is clustered around the traditional view of finance, while very little is to do with being a catalyst for change.

How do CFOs characterize their finance function?

However CFOs choose to define the role of business partnering, each function has its own character and style. According to the survey, 17% have a finance-centric approach to business partnering, limiting the relationship to financial stewardship and performance. A further 18% have to settle for a light-touch approach where they are occasionally invited to become involved in commercial decision-making. This means 35% of senior finance executives are barely involved in any commercial decision-making at all.

More positively, the survey showed that 46% are considered to be trusted advisors, and are sought out by operational business teams for opinions before they make big commercial or financial decisions.

But at the apex of the business partnering journey are the change agents, who make up a paltry 19% of the senior finance executives surveyed. These forward thinkers are frequently catalysts for change, suggesting new business processes and areas where the company can benefit from innovation. This is the next stage in the evolution of both the role of the modern CFO and the role of the finance function at the heart of business innovation. We call CFOs in this category BP² (BP Squared) to denote the huge distance between these forward-thinking individuals and the rest of the pack.

Measuring up

Business partnering can be a subtle yet effective process, but it’s not easy to measure. 57% of organizations have no agreed way of measuring the success of business partnering, and 34% don’t think it’s possible to separate and quantify the value added through this collaboration.

Yet CFOs believe there is a strong correlation between business partnering and profitability – with 91% of respondents saying their business partnering efforts significantly add to profitability. While it’s true that some of the outcomes of business partnering are intangible, it is still important to be able to make a direct connection between it and improved performance, otherwise those efforts may be ineffective but are allowed to continue.

One solution is to use 360 degree appraisals, drawing in a wider gamut of feedback including business partners and internal customers to ascertain the effectiveness of the process. Finance business partnering can also be quantified if there are business model changes, like the move from product sales to services, which require a generous underpinning of financial input to be carried out effectively.

Business partnering offers companies a way to inexpensively

  • pool all their best resources to generate ideas,
  • spark innovation
  • and positively add value to the business.

First CFOs need to recognize the importance of business partnering, widen their idea of how it can add value, and then actually set aside the enough time to become agents of change and growth.

Data unlocks business partnering

Data is the most valuable organizational currency in today’s competitive business environment. Most companies are still in the process of working out the best method to collect, collate and use the tsunami of data available to them in order to generate insight. Some organizations are just at the start of their data journey, others are more advanced, and our research confirms that their data profile will make a significant difference to how well their business partnering works.

FSN2

The survey asked how well respondents’ data supported the role of business partnering, and the responses showed that 18% were data overloaded. This meant business partners have too many conflicting data sources and poor data governance, leaving them with little actual usable data to support the partnering process.

26% were data constrained, meaning they cannot get hold of the data they need to drive insight and decision making.

And a further 34% were technology constrained, muddling through without the tech savvy resources or tools to fully exploit the data they already have. These senior finance executives may know the data is there, sitting in an ERP or CRM system, but can’t exploit it because they lack the right technology tools.

The final 22% have achieved data mastery, where they actively manage their data as a corporate asset, and have the tools and resources to exploit it in order to give their company a competitive edge.

This means 78% overall are hampered by data constraints and are failing to use data effectively to get the best out of their business partnering. While the good intentions are there, it is a weak partnership because there is little of substance to work with.

FSN3

The diagram above is the Business Partnering Maturity Model as it relates to data. It illustrates that there is a huge gap in performance between how effective data masters and data laggards are at business partnering.

The percentage of business partners falling into each category of data management (‘data overloaded’, ‘data constrained,’ etc) has been plotted together with how well these finance functions feel that business partnering is regarded by the operational units as well as their perceived influence on change.

The analysis reveals that “Data masters” are in a league of their own. They are significantly more likely to be well regarded by the operations and are more likely to act as change agents in their business partnering role.

We know from FSN’s 2018 Innovation in Financial Reporting survey that data masters, who similarly made up around one fifth of senior finance executives surveyed, are also more innovative. That research showed they were more likely to have worked on innovative projects in the last three years, and were less likely to be troubled by obstacles to reporting and innovation.

Data masters also have a more sophisticated approach to business partnering. They’re more likely to be change agents, are more often seen as a trusted advisor and they’re more involved in decision making. Interestingly, two-thirds of data masters have a formal or agreed way to measure the success of business partnering, compared to less than 41% of data constrained CFOs, and 36% of technology constrained and data overloaded finance executives. They’re also more inclined to perform 360 degree appraisals with their internal customers to assess the success of their business partnering. This means they can monitor and measure their success, which allows them to adapt and improve their processes.

The remainder, i.e. those that have not mastered their data, are clustered around a similar position on the Business Partnering Maturity Model, i.e., there is little to separate them around how well they are regarded by operational business units or whether they are in a position to influence change.

The key message from this survey is that data masters are the stars of the modern finance function, and it is a sentiment echoed through many of FSN’s surveys over the last few years.

The Innovation in Financial Reporting survey also found that data masters outperformed their less able competitors in three key performance measures that are indicative of financial health and efficiency: 

  • they close their books faster,
  • reforecast quicker and generate more accurate forecasts,
  • and crucially they have the time to add value to the organization.

People, processes and technology

So, if data is the key to driving business partnerships, where do the people, processes and technology come in? Business partnering doesn’t necessarily come naturally to everyone. Where there is no experience of it in previous positions, or if the culture is normally quite insular, sometimes CFOs and senior finance executives need focused guidance. But according to the survey, 77% of organizations expect employees to pick up business partnering on the job. And only just over half offer specialized training courses to support them.

Each company and department or function will be different, but businesses need to support their partnerships, either with formal structures or at the very least with guidance from experienced executives to maximize the outcome. Meanwhile processes can be a hindrance to business partnering in organizations where there is a lack of standardization and automation. The survey found that 71% of respondents agreed or strongly agreed that a lack of automation hinders the process of business partnering.

This was followed closely by a lack of standardization, and a lack of unification, or integration in corporate systems. Surprisingly the constraints of too many or too complex spreadsheets only hindered 61% of CFOs, the lowest of all obstacles but still a substantial stumbling block to effective partnerships. The hindrances reflect the need for better technology to manage the data that will unlock real inter-departmental insight, and 83% of CFOs said that better software to support data analytics is their most pressing need when supporting effective business partnerships.

Meanwhile 81% are looking to future technology to assist in data visualization to make improvements to their business partnering.

FSN4

This echoes the findings of FSN’s The Future of Planning, Budgeting and Forecasting survey which identified users of cutting edge visualization tools as the most effective forecasters. Being able to visually demonstrate financial data and ideas in an engaging and accessible way is particularly important in business partnering, when the counterparty doesn’t work in finance and may have only rudimentary knowledge of complex financial concepts.

Data is a clear differentiator. Business partners who can access, analyze and explain organizational data are more likely to

  • generate real insight,
  • engage their business partners
  • and become a positive agent of change and growth.

Click here to access Workiva’s and FSN’s Survey²

Mastering Risk with “Data-Driven GRC”

Overview

The world is changing. The emerging risk landscape in almost every industry vertical has changed. Effective methodologies for managing risk have changed (whatever your perspective:

  • internal audit,
  • external audit/consulting,
  • compliance,
  • enterprise risk management,

or otherwise). Finally, technology itself has changed, and technology consumers expect to realize more value, from technology that is more approachable, at lower cost.

How are these factors driving change in organizations?:

Emerging Risk Landscapes

Risk has the attention of top executives. Risk shifts quickly in an economy where “speed of change” is the true currency of business, and it emerges in entirely new forms in a world where globalization and automation are forcing shifts in the core values and initiatives of global enterprises.

Evolving Governance, Risk, and Compliance Methodologies

Across risk and control oriented functions spanning a variety of audit functions, fraud, compliance, quality management, enterprise risk management, financial control, and many more, global organizations are acknowledging a need to provide more risk coverage at lower cost (measured in both time and currency), which is driving re-inventions of methodology and automation.

Empowerment Through Technology

Gartner, the leading analyst firm in the enterprise IT space, is very clear that the convergence of four forces—Cloud, Mobile, Data, and Social—is driving the empowerment of individuals as they interact with each other and their information through well-designed technology.

In most organizations, there is no coordinated effort to leverage organizational changes emerging from these three factors in order to develop an integrated approach to mastering risk management. The emerging opportunity is to leverage the change that is occurring, to develop new programs; not just for technology, of course, but also for the critical people, methodology, and process issues. The goal is to provide senior management with a comprehensive and dynamic view of the effectiveness of how an organization is managing risk and embracing change, set in the context of overall strategic and operational objectives.

Where are organizations heading?

“Data Driven GRC” represents a consolidation of methodologies, both functional and technological, that dramatically enhance the opportunity to address emerging risk landscapes and, in turn, maximizing the reliability of organizational performance.

This paper examines the key opportunities to leverage change—both from a risk and an organizational performance management perspective—to build integrated, data-driven GRC processes that optimize the value of audit and risk management activities, as well as the investments in supporting tools and techniques.

Functional Stakeholders of GRC Processes and Technology

The Institute of Internal Auditors’ (IIA) “Three Lines of Defense in Effective Risk Management and Control” model specifically addresses the “who and what” of risk management and control. It distinguishes and describes three role- and responsibility-driven functions:

  • Those that own and manage risks (management – the “first line”)
  • Those that oversee risks (risk, compliance, financial controls, IT – the “second line”)
  • Those functions that provide independent assurance over risks (internal audit – the “third line”)

The overarching context of these three lines acknowledges the broader role of organizational governance and governing bodies.

IIAA

Technology Solutions

Data-Driven GRC is not achievable without a technology platform that supports the steps illustrated above, and integrates directly with the organization’s broader technology environment to acquire the data needed to objectively assess and drive GRC activities.

From a technology perspective, there are four main components required to enable the major steps in Data-Driven GRC methodology:

1. Integrated Risk Assessment

Integrated risk assessment technology maintains the inventory of strategic risks and the assessment of how well they are managed. As the interface of the organization’s most senior professionals into GRC processes, it must be a tool relevant to and usable by executive management. This technology sets the priorities for risk mitigation efforts, thereby driving the development of project plans crafted by each of the functions in the different lines of defense.

2. Project & Controls Management

A project and controls management system (often referred to more narrowly as audit management systems or eGRC systems) enables the establishment of project plans in each risk and control function that map against the risk mitigation efforts identified as required. Projects can then be broken down into actionable sets of tactical level risks, controls that mitigate those risks, and tests that assess those controls.

This becomes the backbone of the organization’s internal control environment and related documentation and evaluation, all setting context for what data is actually required to be tested or monitored in order to meet the organization’s strategic objectives.

3. Risk & Control Analytics

If you think of Integrated Risk Assessment as the brain of the Data-Driven GRC program and the Project & Controls Management component as the backbone, then Risk & Control Analytics are the heart and lungs.

An analytic toolset is critical to reaching out into the organizational environment and acquiring all of the inputs (data) that are required to be aggregated, filtered, and processed in order to route back to the brain for objective decision making. It is important that this toolset be specifically geared toward risk and control analytics so that the filtering and processing functionality is optimized for identifying anomalies representing individual occurrences of risk, while being able to cope with huge populations of data and illustrate trends over time.

4. Knowledge Content

Supporting all of the technology components, knowledge content comes in many forms and provides the specialized knowledge of risks, controls, tests, and data required to perform and automate the methodology across a wide-range of organizational risk areas.

Knowledge content should be acquired in support of individual risk and control objectives and may include items such as:

  • Risk and control templates for addressing specific business processes, problems, or high-level risk areas
  • Integrated compliance frameworks that balance multiple compliance requirements into a single set of implemented and tested controls
  • Data extractors that access specific key corporate systems and extract data sets required for evaluation (e.g., an SAP supported organization may need an extractor that pulls a complete set of fixed asset data from their specific version of SAP that may be used to run all require tests of controls related to fixed assets)
  • Data analysis rule sets (or analytic scripts) that take a specific data set and evaluate what transactions in the data set violate the rules, indicating control failures occurred

Mapping these key technology pieces that make up an integrated risk and control technology platform against the completely integrated Data-Driven GRC methodology looks as follows:

DDGRC

When evaluating technology platforms, it is imperative that each piece of this puzzle directly integrates with the other; otherwise, manual aggregation of results will be required, which is not only laborious but also inconsistent, disorganized and (by definition) violates the Data-Driven GRC methodology.

HiPerfGRC


Click here to access ACL’s study

A Transformation in Progress – Perspectives and approaches to IFRS 17

The International Financial Reporting Standard 17 (IFRS 17) was issued in May 2017 by the International Accounting Standards Board (IASB) and has an effective date of 1st January 2021. The standard represents the most significant change in financial reporting for decades, placing greater demand on legacy accounting and actuarial systems. The regulation is intended to increase transparency and provide greater comparability of profitability across the insurance sector.

IFRS 17 will fundamentally change the face of profit and loss reporting. It will introduce a new set of Key Performance Indicators (KPIs), and change the way that base dividend or gross payments are calculated. To give an example, gross premiums will no longer be recorded under profit and loss. This is just one of the wide-ranging shifts that insurers must take on board in the way they structure their business to achieve the best possible commercial outcomes.

In early 2018 SAS asked 100 executives working in the insurance industry to share their opinions about the standard and strategies for compliance. The research shed light on the sector’s sentiment towards the regulation, challenges and opportunities that IFRS 17 presents, along with the steps organisations are taking to achieve compliance. The aims of the study were to better understand the views of the industry and how insurers are preparing to implement the standard. The objective was to share an unbiased view of the peer group’s analysis of, and approach to, tackling the challenges during the adjustment period. The information garnered is intended to help inform insurers’ decision-making during the early stages of their own projects, helping them arrive at the best-placed strategy for their business.

This report reveals the findings of the survey and provides guidance on how organisations might best achieve compliance. It provides a subjective, datadriven view of IFRS 17 along with valuable market context for insurance professionals who are developing their own strategies for tackling the new standard.

SAS’ research indicates that UK insurers do not underestimate the cost of IFRS 17 or the level of change it will likely introduce. Overall, 97 per cent of survey respondents said that they expected the standard to increase the cost and complexity of operating in insurance.

Companies will need to

  • introduce a new system of KPIs
  • and make changes in management information reports

to monitor performance under the revised profitability metrics. Forward looking strategic planning will also need to incorporate potential volatility and any ramifications within the insurance industry. To achieve this, firms will need to ensure the main parties involved co-operate and work together in a more integrated way.

The cost of these measures will, of course, differ considerably between organisations of different sizes, specialisms and complexities. However, the cost of compliance also greatly depends on

  • the approach taken by decision-makers,
  • the partners they choose
  • and the solutions they select.

Perhaps more instructive is that 90 per cent believe compliance costs will be greater than those demanded by the Solvency II Directive, aimed at insurers retaining strong financial buffers so they can meet claims from policyholders.

The European Commission estimated that it cost EU insurers between £3 and £4 billion to implement Solvency II, which was designed to standardise what had been a piecemeal approach to insurance regulations across the EU. Almost half (48 per cent) predict that IFRS 17 will cost substantially more.

Respondents are preparing for major alterations to their current accounting and actuarial systems, from minor upgrades all the way to wholesale replacements. Data management systems will be the prime target for review, with 84 per cent of respondents planning to either make additional investment (25 per cent), upgrade (34 per cent), or replace them (25 per cent). Finance, accounting and actuarial systems will also see significant innovation, as 83 per cent and 81 per cent respectively prepare for significant investment.

The use of analytics appears to be the most divisive area for insurers. While 27 per cent of participants are confident they will need to make no changes to their analytics systems or processes, 28 per cent plan to replace them entirely. A majority of 71 per cent still expect to make at least some reform.

IFRS17

IFRS17 2

Click here to access SAS’ Whitepaper


The IFRS 9 Impairment Model and its Interaction with the Basel Framework

In the wake of the 2008 financial crisis, the International Accounting Standards Board (IASB) in cooperation with the Financial Accounting Standards Board (FASB) launched a project to address the weaknesses of both International Accounting Standard (IAS) 39 and the US generally accepted accounting principles (GAAP), which had been the international standards for determining financial assets and liabilities accounting in financial statements since 2001.

By July 2014, the IASB finalized and published its new International Financial Reporting Standard (IFRS) 9 methodology, to be implemented by January 1, 2018 (with the standard available for early adoption). IFRS 9 will cover financial organizations across Europe, the Middle East, Asia, Africa, Oceana, and the Americas (excluding the US). For financial assets that fall within the scope of the IFRS 9 impairment approach, the impairment accounting expresses a financial asset’s expected credit loss as the projected present value of the estimated cash shortfalls over the expected life of the asset. Expected losses may be considered on either a 12-month or lifetime basis, depending on the level of credit risk associated with the asset, and should be reassessed at each reporting date. The projected value is then recognized in the profit and loss (P&L) statement.

Most banks subject to IFRS 9 are also subject to Basel III Accord capital requirements and, to calculate credit risk-weighted assets, use either standardized or internal ratings-based approaches. The new IFRS 9 provisions will impact the P&L that in turn needs to be reflected in the calculation for impairment provisions for regulatory capital. The infrastructure to calculate and report on expected loss drivers of capital adequacy is already in place. The data, models, and processes used today in the Basel framework can in some instances be used for IFRS 9 provision modeling, albeit with significant adjustments. Not surprisingly, a Moody’s Analytics survey conducted with 28 banks found that more than 40% of respondents planned to integrate IFRS 9 requirements into their Basel infrastructure.

Arguably the biggest change brought by IFRS 9 is incorporation of credit risk data into an accounting and therefore financial reporting process. Essentially, a new kind of interaction between finance and risk functions at the organization level is needed, and these functions will in turn impact data management processes. The implementation of the IFRS 9 impairment model challenges the way risk and finance data analytics are defined, used, and governed throughout an institution. IFRS 9 is not the only driver of this change.

Basel Committee recommendations, European Banking Authority (EBA) guidelines and consultation papers, and specific supervisory exercises, such as stress testing and Internal Capital Adequacy Assessment Process (ICAAP), are forcing firms to consider a more data-driven and forward-looking approach in risk management and financial reporting.

Accounting and Risk Management: An Organization and Cultural Perspective

The implementation of IFRS 9 processes that touch on both finance and risk functions creates the need to take into account differences in culture, as well as often different understandings of the concept of loss in the two functions.

  • The finance function is focused on product (i.e., internal reporting based on internal data) and is driven by accounting standards.
  • The risk function, however, is focused on the counterparty (i.e., probability of default) and is driven by a different set of regulations and guidelines.

This difference in focus leads the two functions to adopt these differing approaches when dealing with impairment:

  • The risk function uses a stochastic approach to model losses, and a database to store data and run the calculations.
  • Finance uses arithmetical operations to report the expected/ incurred losses on the P&L, and uses decentralized data to populate reporting templates.

In other words, finance is driven by economics, and risk by statistical analysis. Thus, the concept of loss differs between teams or groups: A finance team views it as part of a process and analyzes loss in isolation from other variables, while the risk team sees loss as absolute and objectively observable with an aggregated view.

IFRS 9 requires a cross-functional approach, highlighting the need to reconcile risk and finance methodologies.

The data from finance in combination with the credit risk models from risk should drive the process.

  • The risk function runs the impairment calculation, whilst providing objective, independent, and challenger views (risk has no P&L or bonus-driven incentive) to the business assumptions.
  • Finance supports the process by providing data and qualitative overlay.

Credit Risk Modeling and IFRS 9 Impairment Model

Considering concurrent requirements across a range of regulatory guidelines, such as stress testing, and reporting requirements, such as common reporting (COREP) and financial reporting (FINREP), the challenge around the IFRS 9 impairment model is two-fold:

  • Models: How to harness the current Basel-prescribed credit risk models to make them compliant with the IFRS 9 impairment model.
  • Data: How (and whether) the data captured for Basel capital calculation can be used to model expected credit losses under IFRS 9.

IFRS9 Basel3

Click here to access Moody’s detailed report

Mastering Risk with “Data-Driven GRC”

Where are organizations heading ?

“Data Driven GRC” represents a consolidation of methodologies, both functional and technological, that dramatically enhance the opportunity to address emerging risk landscapes and, in turn, maximizing the reliability of organizational performance. This paper examines the key opportunities to leverage change—both from a risk and an organizational performance management perspective—to build integrated, data-driven GRC processes that optimize the value of audit and risk management activities, as well as the investments in supporting tools and techniques.

Functional Stakeholders of GRC Processes and Technology

The Institute of Internal Auditors’ (IIA) “Three Lines of Defense in Effective Risk Management and Control” model specifically addresses the “who and what” of risk management and control. It distinguishes and describes three role- and responsibility-driven functions :

  • Those that own and manage risks (management – the “first line”)
  • Those that oversee risks (risk, compliance, financial controls, IT – the “second line”)
  • Those functions that provide independent assurance over risks (internal audit – the “third line”)

The overarching context of these three lines acknowledges the broader role of organizational governance and governing bodies.

Technology Deficiencies in the Three Lines of Defense

Since the emergence of Sarbanes-Oxley, the use of technology in risk and control related processes has truly started to take meaningful shape in many organizations. However, when looking across the risk and control oriented functions in most organizations, technology is still typically used on a departmental or point solution basis.

Third Line (internal audit) use of risk & control technology

For the past decade, surveys of internal auditors have consistently identified the more effective use of technology as among the most pressing issues facing the profession. Specifically, the responses to the surveys also referred to the need for increased use of technology for audit analysis, fraud detection, and continuous auditing. Other surveys also highlight a shortage of sufficient technology and data analysis skills within audit departments.

Much of the driving force for improving the use of technology is based on the desire to make the audit process itself more efficient and more effective, as well as to deliver more tangible value to the rest of the organization.

During the past decade, the role of the internal audit function itself has changed considerably. Internal audit’s traditional focus on cyclical audits and testing internal controls is evolving into one in which internal audit is expected to assess and report on the effectiveness of management’s processes to address risk overall. This often includes providing guidance and consultation to the business on best practices for managing risk and compliance within business process areas and maintaining effective control systems. The use of technology is an increasingly critical component of these best practices and in some cases internal audit is able to champion the implementation of high-impact, high-value technology within the business’s risk management and compliance processes, based on their own experience in using technology for assurance purposes.

There is considerable variation in the extent to which internal audit departments leverage technology. However it is certainly fair to say that for audit to be truly valuable and relevant within the context of organizational strategy, a significant improvement is required across the board. Internal audit as a profession simply is not moving forward at the pace of technology.

Some specific statistics from recent research reveals:

  • Only approximately 40% of internal audit departments use audit and documentation management systems from specialized vendors. The remainder use disorganized tools and processes, typically based on Microsoft Office® & shared folders.
  • Audit programs for specific business process areas and industries are usually developed through a combination of previously used programs and those shared on various audit-related websites. This approach does not address organization-specific risk.
  • Next generation testing techniques, especially data analytics, are overwhelmingly underutilized.

Second Line (risk, compliance, financial controls, IT) use of risk & control technology

Outside of audit, in other areas of risk and compliance, some organizations have acquired specialized departmental software, but the majority use only basic Office tools to maintain inventories of risks, document controls and perform risk assessments. In larger enterprises, it is not unusual to have a variety of different technologies and approaches applied in different operational entities or in different functional areas. This approach is usually more costly and less effective than one based on a common platform. Effective testing methods using technology are usually unavailable or left unconsidered.

In fact, second line of defense functions often rely heavily on inquiry-based methods such as surveying, which are proven ineffective at identifying the actual manifestations of risk in the organization. If analytical software is used in the business for investigations or monitoring transactions, it in many cases involves standard query tools or some form of generic business intelligence (BI) technology. Although good for providing summary level information or high-level trends, BI tools struggle to show the root cause of problems. And while they may have certain capabilities to prevent fraud and errors from occurring, or to flag exceptions, they are not sufficient to effectively trap the typical problem transactions that occur.

First Line (management) use of risk & control technology

While in some cases, first line management have access to better technology for use on specific pain point areas (e.g., continuous transaction monitoring technology used within finance departments), there is a common tendency for management to place far too much reliance on core business systems for effective control. While the large ERP and other system vendors seem to have extensive capabilities for preventing control deficiencies, the reality is that these are extremely extensive and complex systems and internal controls are usually the afterthought of those implementing them, not a core focus. For example, in many cases certain control settings are turned off to enable the ERP system to run more efficiently.

An integrated and collaborative approach to managing risks and monitoring controls in collaboration with the second and third lines of defense, using a common, independent methodology and technology platform, typically proves the most effective in accomplishing management’s key risk mitigation strategies.

DD GRC


Click here to access ACL’s White Paper

By investing heavily in start-ups and technology, (re)insurance companies appear to have assumed a semblance of control over the InsurTech revolution

Who Benefits from Modularization?

With technology moving forward at an unprecedented pace, incumbents are increasingly electing to outsource functions to highly specialized new entrants, renting evolving modules of technology that can be tailored to suit their individual needs. Though this approach may be more cost effective, it further fuels the question of whether incumbents will allow value in the industry to shift towards new entrants. In time, market participants will come to understand which module in the chain generates the most value. It is plausible that automation in distribution will shift value towards efficiency of internal processes that support cutting-edge modeling and underwriting engines.

InsT0

The State of InsurTech

InsurTech funding volume increased 36% year-over-year in 2017, demonstrating that technology driven innovation remains a core focus area for (re)insurance companies and investors heading into 2018. However, perhaps contrary to many of the opinions championed in editorial and press coverage of the InsurTech sector, further analysis of the growing number of start-ups successfully attracting capital from (re)insurers and financial investors reveals that the majority of InsurTech ventures are not focused on exiling incumbents by disrupting the pressured insurance value chain. According to research from McKinsey & Company,

  • 61% of InsurTech companies aim to enable the value chain,
  • 30% are attempting to disintermediate incumbents from customers
  • 9% are targeting full scale value chain disruption.

Has the hype surrounding InsurTech fostered unjustified fear from overly defensive incumbents?

We have taken this analysis a step further by tracking funding volume from strategic (re)insurers versus financial investors for InsurTechs focused on enabling the value chain relative to their counterparts attempting to disintermediate customers from incumbents or disrupt the value chain altogether and found that 65% of strategic (re)insurer InsurTech investments have been concentrated in companies enabling the value chain, with only 35% of incumbent investments going to start-ups with more disruptive business models. What does it mean? While recognizing the subjective nature of surmising an early stage company’s ultimate industry application at maturity from its initial focus, we attribute this phenomenon to the tendency of incumbents to, consciously or subconsciously, encourage development of less perceptibly threatening innovation while avoiding more radical, potentially intimidating technologies and applications.

Recognizing that this behavior may allow incumbents to preserve a palatable status quo, it should be considered in the context in which individual investments are evaluated – on the basis of expected benefits relative to potential risk. We have listed several benefits that InsurTechs offer to incumbents :

InsT1

Segmenting the InsurTech Universe

As InsurTech start-ups continue to emerge across the various components of the insurance value chain and business lines, incumbents and investors are evaluating opportunities to deploy these applications in the insurance industry today and in the future. To simplify the process of identifying useful and potentially transformational technologies and applications, we have endeavored to segment the increasingly broad universe of InsurTech companies by their core function into four categories:

  1. Product & Distribution
  2. Business Process Enhancement
  3. Data & Analytics
  4. Claims Management

This exercise is complicated by the tendency of companies to operate across multiple functions, so significant professional judgment was used in determining the assignment for each company. A summary of the criteria used to determine placement is listed below. On the following pages, we have included market maps to provide a high level perspective of the number of players in each category, as well as a competitive assessment of each subsector and our expectations for each market going forward. Selected companies in each category, ranked by the amount of funding they have raised to date, are listed, followed by more detailed overviews and Q&A with selected representative companies from each subsector.

InsT2

Click here to access WTW’s detailed birefing