Achieving Effective IFRS 17 Reporting – Enabling the right accounting policy through technology

Executive summary

International Financial Reporting Standard (IFRS) 17, the first comprehensive global accounting standard for insurance products, is due to be implemented in 2023, and is the latest standard developed by the International Accounting Standards Board (IASB) in its push for international accounting standards.

IFRS 17, following other standards such as IFRS 9 and Current Expected Credit Losses (CECL), is the latest move toward ‘risk-ware accounting’, a framework that aims to incorporate financial and non-financial risk into accounting valuation.

As a principles-based standard, IFRS 17 provides room for different interpretations, meaning that insurers have choices to make about how to comply. The explicit integration of financial and non-financial risk has caused much discussion about the unprecedented and distinctive modeling challenges that IFRS 17 presents. These could cause ‘tunnel vision’ among insurers when it comes to how they approach compliance.

But all stages of IFRS 17 compliance are important, and each raises distinct challenges. By focusing their efforts on any one aspect of the full compliance value chain, insurers can risk failing to adequately comply. In the case of IFRS 17, it is not necessarily accidental non-compliance that is at stake, but rather the sub-optimal presentation of the business’ profits.

To achieve ‘ideal’ compliance, firms need to focus on the logistics of reporting as much as on the mechanics of modeling. Effective and efficient reporting comprises two elements: presentation and disclosure. Reporting is the culmination of the entire compliance value chain, and decisions made further up the chain can have a significant impact on the way that value is presented. Good reporting is achieved through a mixture of technology and accounting policy, and firms should follow several strategies in achieving this:

  • Anticipate how the different IFRS 17 measurement models will affect balance sheet volatility.
  • Understand the different options for disclosure, and which approach is best for specific institutional needs.
  • Streamline IFRS 17 reporting with other reporting duties.
  • Where possible, aim for collaborative report generation while maintaining data integrity.
  • Explore and implement technology that can service IFRS 17’s technical requirements for financial reporting.
  • Store and track data on a unified platform.

In this report we focus on the challenges associated with IFRS 17 reporting, and consider solutions to those challenges from the perspectives of accounting policy and technology implementation. And in highlighting the reporting stage of IFRS 17 compliance, we focus specifically on how decisions about the presentation of data can dictate the character of final disclosure.

  • Introduction: more than modeling

IFRS 17 compliance necessitates repeated stochastic calculations to capture financial and nonfinancial risk (especially in the case of long-term insurance contracts). Insurance firms consistently identify modeling and data management as the challenges they most anticipate having to address in their efforts to comply. Much of the conversation and ‘buzz’ surrounding IFRS 17 has therefore centered on its modeling requirements, and in particular the contractual service margin (CSM) calculation.

But there is always a danger that firms will get lost in the complexity of compliance and forget the aim of IFRS 17. Although complying with IFRS 17 involves multiple disparate process elements and activities, it is still essentially an accounting
standard
. First and foremost its aim is to ensure the transparent and comparable disclosure of the value of insurance services.
So while IFRS 17 calculations are crucial, they are just one stage in the compliance process, and ultimately enable the intended outcome: reporting.

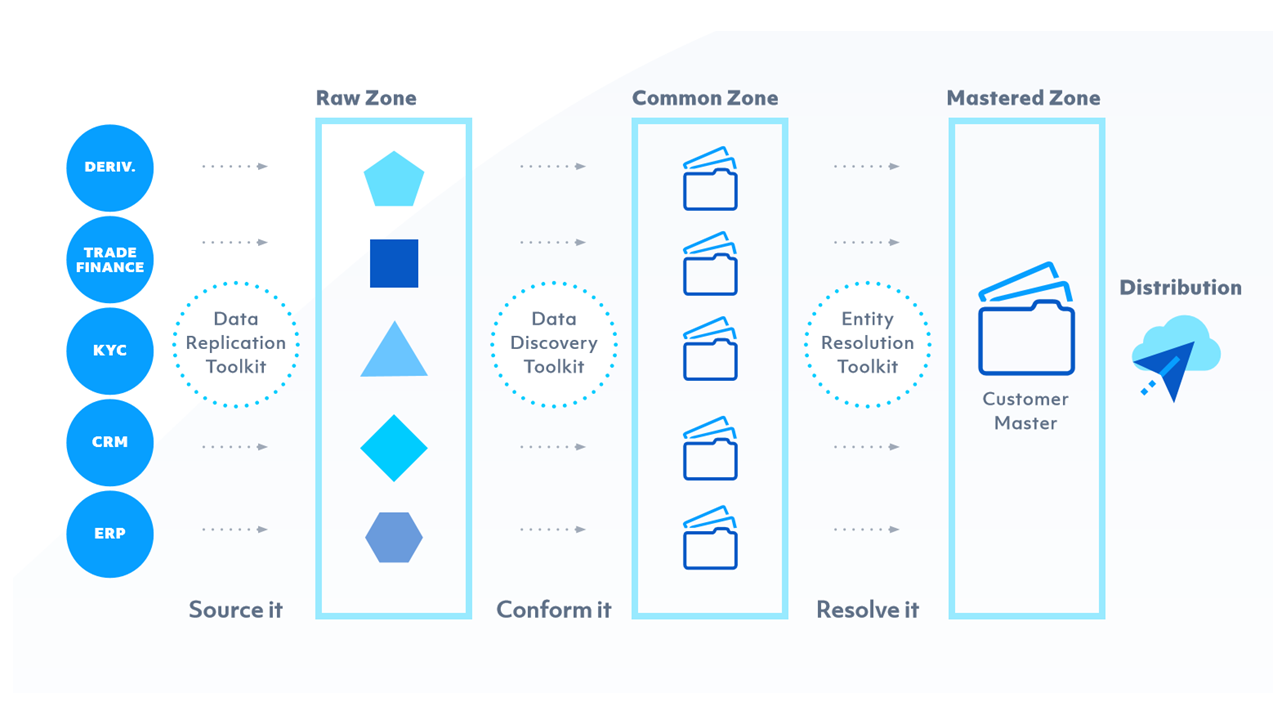
Complying with the modeling requirements of IFRS 17 should not create ‘compliance tunnel vision’ at the expense of the presentation and disclosure of results. Rather, presentation and disclosure are the culmination of the IFRS 17 compliance process flow and are key elements of effective reporting (see Figure 1).

  • Developing an IFRS 17 accounting policy

A key step in developing reporting compliance is having an accounting policy tailored to a firm’s specific interaction with IFRS 17. Firms have decisions to make about how to comply, together with considerations of the knock-on effects IFRS 17 will have on the presentation of their comprehensive statements of income.

There are a variety of considerations: in some areas IFRS 17 affords a degree of flexibility; in others it does not. Areas that will substantially affect the appearance of firms’ profits are:

• The up-front recognition of loss and the amortization of profit.
• The new unit of account.
• The separation of investment components from insurance services.
• The recognition of interest rate changes under the general measurement model (GMM).
Deferred acquisition costs under the premium allocation approach (PAA).

As a principles-based standard, IFRS 17 affords a degree of flexibility in how firms approach valuation. One of its aims is to insure that entity specific risks and diverse contract features are adequately reflected in valuations, while still safeguarding reporting comparability. This flexibility also gives firms some degree of control over the way that value and risk are portrayed in financial statements. However, some IFRS 17 stipulations will lead to inevitable accounting mismatches and balance-sheet volatility.

Accounting policy impacts and choices – Balance sheet volatility

One unintended consequence of IFRS 17 compliance is balance sheet volatility. As an occurrence of risk-aware accounting, IFRS 17 requires the value of insurance services to be market-adjusted. This adjustment is based on a firm’s projection of future cash flow, informed by calculated financial risk. Moreover, although this will not be the first time firms are incorporating non-financial risk into valuations, it is the first time it has to be explicit.

Market volatility will be reflected in the balance sheet, as liabilities and assets are subject to interest rate fluctuation and other financial risks. The way financial risk is incorporated into the value of a contract can also contribute to balance sheet volatility. The way it is incorporated is dictated by the measurement model used to value it, which depends on the eligibility of the contract.

There are three measurement models, the PAA, the GMM and the variable fee approach (VFA). All three are considered in the next section.

The three measurement models

Features of the three measurement models (see Figure 2) can have significant effects on how profit – represented by the CSM – is presented and ultimately disclosed.

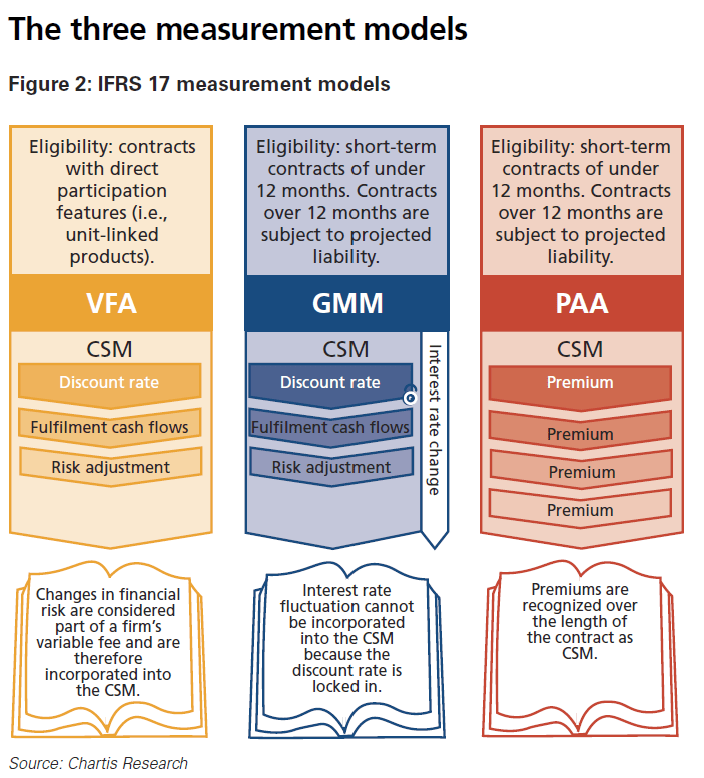
To illustrate the choices around accounting policy that insurance firms will need to consider and make, we provide two specific examples, for the PAA and the GMM.

Accounting policy choices: the PAA

When applying the PAA to shorter contracts – generally those of fewer than 12 months – firms have several choices to make about accounting policy. One is whether to defer acquisition costs. Unlike previous reporting regimes, under IFRS17’s PAA indirect costs cannot be deferred as acquisition costs. Firms can either expense these costs upfront or defer them and amortize the cost over the length of the contract. Expensing acquisition costs as they are incurred may affect whether a group of contracts is characterized as onerous at inception. Deferring acquisition costs reduces the liability for the remaining coverage; however, it may also increase the loss recognized in the income statement for onerous contracts.

Accounting policy choices: the GMM

Under IFRS 17, revenue is the sum of

  • the release of CSM,
  • changes in the risk adjustment,
  • and expected net cash outflows, excluding any investment components.

Excluding any investment component from revenue recognition will have significant impacts on contracts being sold by life insurers.

Contracts without direct participation features measured under the GMM use a locked-in discount rate – whether this is calculated ‘top down’ or ‘bottom up’ is at the discretion of the firm. Changes to the CSM have to be made using the discount rate set at the initial recognition of the contract. Changes in financial variables that differ from the locked-in discount rate cannot be integrated into the CSM, so appear as insurance service value.

A firm must account for the changes directly in the comprehensive income statement, and this can also contribute to balance sheet volatility.

As part of their accounting policy firms have a choice about how to recognize changes in discount rates and other changes to financial risk assumptions – between other comprehensive income (OCI) and profit and loss (P&L). Recognizing fluctuations in discount rates and financial risk in the OCI reduces some volatility in P&L. Firms also recognize the fair value of assets
in the OCI under IFRS 9.

  • The technology perspective

Data integrity and control

At the center of IFRS 17 compliance and reporting is the management of a wide spectrum of data – firms will have to gather and generate data from historic, current and forward-looking perspectives.

Creating IFRS 17 reports will be a non-linear process, and data will be incorporated as it becomes available from multiple sources. For many firms, contending with this level of data granularity and volume will be a big leap from other reporting requirements. The maturity of an insurer’s data infrastructure is partly defined by the regulatory and reporting context it was built in, and in which it operates – entities across the board will have to upgrade their data management technology.

In regions such as Southeast Asia and the Middle East, however, data management on the scale of IFRS 17 is unprecedented. Entities operating in these regions in particular will have to expend considerable effort to upgrade their infrastructure. Manual spreadsheets and complex legacy systems will have to be replaced with data management technology across the compliance value chain.

According to a 2018 survey by Deloitte, 87% of insurers believed that their systems technology required upgrades to capture the new data they have to handle and perform the calculations they require for compliance. Capturing data inputs was cited as the biggest technology challenge.

Tracking and linking the data lifecycle

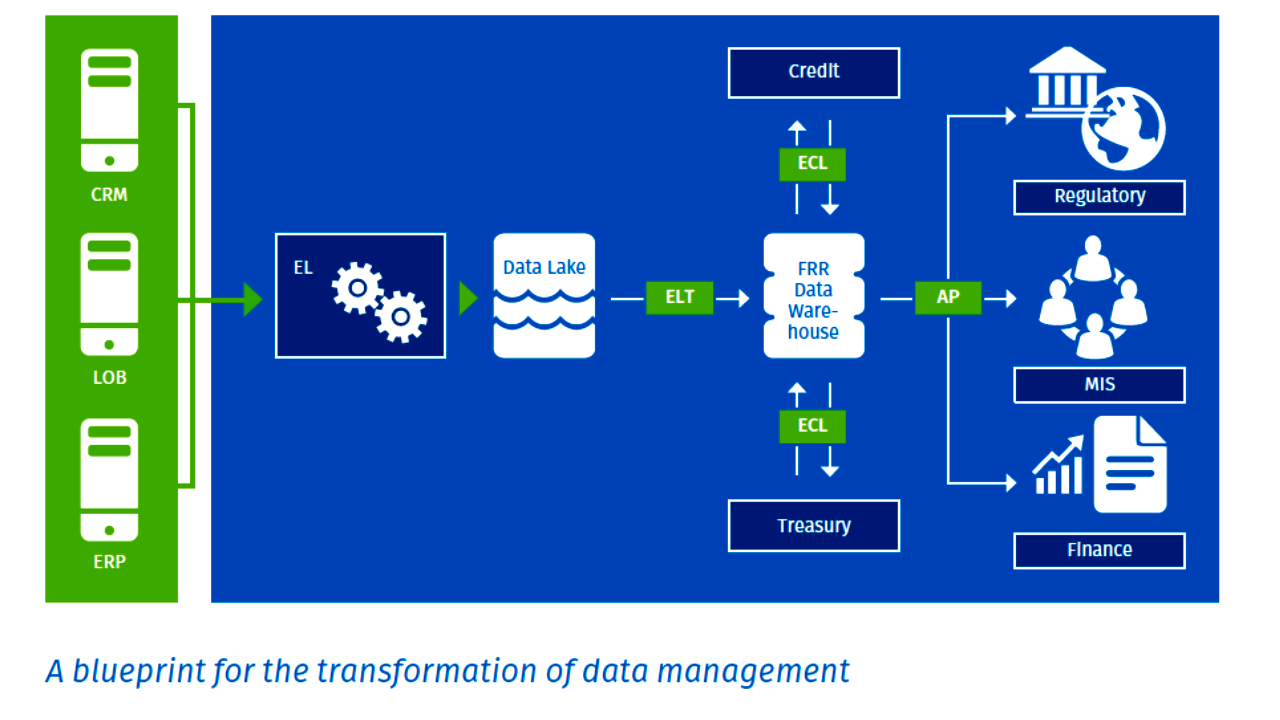
Compliance with IFRS 17 demands data governance across the entire insurance contract valuation process. The data journey starts at the data source and travels through aggregation and modeling processes all the way to the disclosure stage (see Figure 3).

In this section we focus on the specific areas of data lineage, data tracking and the auditing processes that run along the entire data compliance value chain. For contracts longer than 12 months, the valuation process will be iterative, as data is transformed multiple times by different users. Having a single version of reporting data makes it easier to collaborate, track and manage the iterative process of adapting to IFRS 17. Cloud platforms help to address this challenge, providing an effective means of storing and managing the large volumes of reporting data generated by IFRS 17. The cloud allows highly scalable, flexible technology to be delivered on demand, enabling simultaneous access to the same data for internal teams and external advisors.

It is essential that amendments are tracked and stored as data falls through different hands and passes through different IFRS 17 ‘compliance stages’. Data lineage processes can systematically track users’ interactions with data and improve the ‘auditability’ of the compliance process and users’ ‘ownership’ of activity.

Data linking is another method of managing IFRS 17 reporting data. Data linking contributes to data integrity while enabling multiple users to make changes to data. It enables the creation of relationships across values while maintaining the integrity of the source value, so changing the source value creates corresponding changes across all linked values. Data linking also enables the automated movement of data from spreadsheets to financial reports, updating data as it is changed and tracking users’ changes to it.

Disclosing the data

Highlighting how IFRS 17 is more than just a compliance exercise, it will have a fundamental impact on how insurance companies report their data internally, to regulators, and to financial markets. For the final stage of compliance, firms will need to adopt a new format for the balance sheet, P&L statement and cash flow statements.

In addition to the standard preparation of financial statements, IFRS 17 will require a number of disclosures, including the explanation of recognized amounts, significant judgements made in applying IFRS 17, and the nature and extent of risks arising from insurance contracts. As part of their conversion to IFRS 17, firms will need to assess how data will have to be managed on a variety of levels, including

  • transactions,
  • financial statements,
  • regulatory disclosures,
  • internal key performance indicators
  • and communications to financial markets.

Communication with capital markets will be more complex, because of changes that will have to be made in several areas:

  • The presentation of financial results.
  • Explanations of how calculations were made, and around the increased complexity of the calculations.
  • Footnotes to explain how data is being reported in ‘before’ and ‘after’ conversion scenarios.

During their transition, organizations will have to report and explain to the investor community which changes were the result of business performance and which were the result of a change in accounting basis. The new reporting basis will also impact how data will be reported internally, as well as overall effects on performance management. The current set of key metrics used for performance purposes, including volume, revenue, risk and profitability, will have to be adjusted for the new methodology and accounting basis. This could affect how data will be reported on and reconciled for current regulatory reporting requirements including Solvency II, local solvency standards, and broader statutory and tax reporting.

IFRS 17 will drive significant changes in the current reporting environment. To address this challenge, firms must plan how they will manage both the pre-conversion and post-conversion data sets, the preparation of pre-, post-, and comparative financial statements, and the process of capturing and disclosing all of the narrative that will support and explain these financial results.

In addition, in managing the complexity of the numbers and the narrative before, during and after the conversion, reporting systems will also need to scale to meet the requirements of regulatory reporting – including disclosure in eXtensible Business
Reporting Language (XBRL) in some jurisdictions. XBRL is a global reporting markup language that enables the encoding of documents in a human and machine-legible format for business reporting (The IASB publishes its IFRS Taxonomy files in
XBRL).

But XBRL tagging can be a complex, time-consuming and repetitive process, and firms should consider using available technology partners to support the tagging and mapping demands of document drafting.

A Practical Guide to Analytics and AI in the Cloud With Legacy Data

Introduction

Businesses that use legacy data sources such as mainframe have invested heavily in building a reliable data platform. At the same time, these enterprises want to move data into the cloud for the latest in analytics, data science and machine learning.

The Importance of Legacy Data

Mainframe is still the processing backbone for many organizations, constantly generating important business data.

It’s crucial to consider the following:

MAINFRAME IS THE ENTERPRISE TRANSACTION ENVIRONMENT

In 2019, there was a 55% increase in transaction volume on mainframe environments. Studies estimate that 2.5 billion transactions are run per day, per legacy system across the world.

LEGACY IS THE FUEL BEHIND CUSTOMER EXPERIENCES

Within industries such as financial services and insurance, most customer information lives on legacy systems. Over 70% of enterprises say their customer-facing applications are completely or very reliant on mainframe processing.

BUSINESS-CRITICAL APPLICATIONS RUN ON LEGACY SYSTEMS

Mainframe often holds business-critical information and applications — from credit card transactions to claims processing. For over half of enterprises with a mainframe, they run more than half of their business-critical applications on the platform.

However, they also present a limitation for an organization in its analytics and data science journey. While moving everything to the cloud may not be the answer, identifying ways in which you can start a legacy modernization process is crucial to the next generation of data and AI initiatives.

The Cost of Legacy Data

Across the enterprise, legacy systems such as mainframe serve as a critical piece of infrastructure that is ripe with opportunity for integration with modern analytics platforms. If a modern analytics platform is only as good as the data fed into it, that means enterprises must include all data sources for success. However, many complexities can occur when organizations look to build the data integration pipelines between their modern analytics platform and legacy sources. As a result, the plans made to connect these two areas are often easier said than done.

DATA SILOS HINDER INNOVATION

Over 60% of IT professionals with legacy and modern technology in house are finding that data silos are negatively affecting their business. As data volumes increase, IT can no longer rely on current data integration approaches to solve their silo challenges.

CLOUDY BUSINESS INSIGHTS

Business demands that more decisions are driven by data. Still, few IT professionals who work with legacy systems feel they are successful in delivering data insights that reside outside their immediate department. Data-driven insights will be the key to competitive success. The inability to provide insights puts a business at risk.

SKILLS GAP WIDENS

While it may be difficult to find skills for the latest technology, it’s becoming even harder to find skills for legacy platforms. Enterprises have only replaced 37% of the mainframe workforce lost over the past five years. As a result, the knowledge needed to integrate mainframe data into analytics platforms is disappearing. While the drive for building a modern analytics platform is more powerful than ever, taking this initiative and improving data integration practices that encompass all enterprise data has never been more challenging.

The success of building a modern analytics platform hinges on understanding the common challenges of integrating legacy data sources and choosing the right technologies that can scale with the changing needs of your organization.

Challenges Specific to Extracting Mainframe Data

With so much valuable data on mainframe, the most logical thing to do would be to connect these legacy data sources to a modern data platform. However, many complexities can occur when organizations begin to build integration pipelines to legacy sources. As a result, the plans made to connect these two areas are often easier said than done. Shared challenges of extracting mainframe data for integration with modern analytics platforms include the following:

DATA STRUCTURE

It’s common for legacy data not to be readily compatible with downstream analytics platforms, open-source frameworks and data formats. The varied structures of legacy data sources differ from relational data. Legacy data sources have traits such as

  • hierarchical tables,
  • embedded headers,
  • and trailer and complex data structures (e.g., nested, repeated or redefined elements).

With the incorrect COBOL redefines and logic set up at the start of a data integration workflow, legacy data structures risk slowing down processing speeds to the point of business disruption and can lead to incorrect data for downstream consumption.

METADATA

COBOL copybooks can be a massive hurdle to overcome for integrating mainframe data. COBOL copybooks are the metadata blocks that define the physical layout of data but are stored separately from that data. As a result, they can be quite complicated, containing not just formatting information, but also logic in the form, for example, of nested Occurs Depending On clauses. For many mainframe files, hundreds of copybooks may map to a single file. Feeding mainframe data directly into an analytics platform can result in significant data confusion.

DATA MAPPING

Unlike an RDBMS, which needs data to be entered into a table or column, nothing enforces a set data structure on the mainframe. COBOL copybooks are incredibly flexible so that they

  • can group multiple pieces into one,
  • or subdivide a field into various fields,
  • or ignore whole sections of a record.

As a result, data mapping issues will arise. The copybooks reflect the needs of the program, not the needs of a data-driven view.

DIFFERENT STORAGE FORMATS

Often numeric values stored one way on a mainframe are stored differently when the data is moving to the cloud. Additionally, mainframes use a whole different encoding scheme (EBCDIC vs. ASCII) — it’s an 8-bit structure vs. a 7-bit structure. As a result, multiple numeric encoding schemes allow for the ability to “pack” numbers into less storage (e.g., packed decimal) space. In addition to complex storage formats, there are techniques to use each individual bit to store data.

Whether it’s a lack of internal knowledge on how to handle legacy data or a rigid data framework, ignoring legacy data when building a modern data analytics platform means missing valuable information that can enhance any analytics project.

Pain Points of Building a Modern Analytics Platform

Tackling the challenges of mainframe data integration is no simple task. Besides determining the best approach for integrating these legacy data sources, IT departments are also dealing with the everyday challenges of running a department. Regardless of the size of an organization, there are daily struggles everyone faces, from siloed data to lack of IT skills.

ENVIRONMENT COMPLEXITY

Many organizations have adopted hybrid and multi-cloud strategies to

  • manage data proliferation,
  • gain flexibility,
  • reduce costs
  • and increase capacities.

Cloud storage and the lakehouse architecture offer new ways to manage and store data. However, organizations still need to maintain and integrate their mainframes and other on-premises systems — resulting in a challenging integration strategy that must encompass a variety of environments.

SILOED DATA

The increase in data silos adds further complexity to growing data volumes. Data silo creation happens as a direct result of increasing data sources. Research has shown that data silos have directly inhibited the success of analytics and machine learning projects.

PERFORMANCE

Processing the requirements of growing data volumes can cause a slowdown in a data stream. Loading hundreds, or even thousands, of database tables into a big data platform — combined with an inefficient use of system resources — can create a data bottleneck that hampers the performance of data integration pipelines.

DATA QUALITY

Industry studies have shown that up to 90% of a data scientist’s time is getting data to the right condition for use in analytics. In other words, 90% of the time, data feeding analytics cannot be trusted. Data quality processes that include

  • mapping,
  • matching,
  • linking,
  • merging,
  • deduplication
  • and actionable data

are critical to providing frameworks with trusted data.

DATA TYPES AND FORMATS

Valuable data for analytics comes from a range of sources across the organization from CRM, ERPs, mainframes and online transaction processing systems. However, as organizations rely on more systems, the data types and formats continue to grow.

IT now has the challenge of making big data, NoSQL and unstructured data all readable for downstream analytics solutions.

SKILLS GAP AND RESOURCES

The need for workers who understand how to build data integration frameworks for mainframe, cloud, and cluster data sources is increasing, but the market cannot keep up. Studies have shown that unfilled data engineer jobs and data scientist jobs have increased 12x in the past year alone. As a result, IT needs to figure out how to integrate data for analytics with the skills they have internally.

What Your Cloud Data Platform Needs

A new data management paradigm has emerged that combines the best elements of data lakes and data warehouses, enabling

  • analytics,
  • data science
  • and machine learning

on all your business data: lakehouse.

Lakehouses are enabled by a new system design: implementing similar data structures and data management features to those in a data warehouse, directly on the kind of low-cost storage used for data lakes. They are what you would get if you had to redesign data warehouses in the modern world, now that cheap and highly reliable storage (in the form of object stores) are available.

This new paradigm is the vision for data management that provides the best architecture for modern analytics and AI. It will help organizations capture data from hundreds of sources, including legacy systems, and make that data available and ready for analytics, data science and machine learning.

Lakehouse

A lakehouse has the following key features:

  • Open storage formats, such as Parquet, avoid lock-in and provide accessibility to the widest variety of analytics tools and applications
  • Decoupled storage and compute provides the ability to scale to many concurrent users by adding compute clusters that all access the same storage cluster
  • Transaction support handles failure scenarios and provides consistency when multiple jobs concurrently read and write data
  • Schema management enforces the expected schema when needed and handles evolving schemas as they change over time
  • Business intelligence tools directly access the lakehouse to query data, enabling access to the latest data without the cost and complexity of replicating data across a data lake and a data warehouse
  • Data science and machine learning tools used for advanced analytics rely on the same data repository
  • First-class support for all data types across structured, semi-structured and unstructured, plus batch and streaming data

Click here to access Databricks’ and Precisely’s White Paper

How To Build a CX Program And Transform Your Business

Customer Experience (CX) is a catchy business term that has been used for decades, and until recently, measuring and managing it was not possible. Now, with the evolution of technology, a company can build and operationalize a true CX program.

For years, companies championed NPS surveys, CSAT scores, web feedback, and other sources of data as the drivers of “Customer Experience” – however, these singular sources of data don’t give a true, comprehensive view of how customers feel, think, and act. Unfortunately, most companies aren’t capitalizing on the benefits of a CX program. Less than 10% of companies have a CX executive and of those companies, only 14% believe Customer Experience, as a program, is the aggregation and analysis of all customer interactions with the objective of uncovering and disseminating insights across the company in order to improve the experience. In a time where the customer experience separates the winners from the losers, CX must be more of a priority for ALL businesses.

This not only includes the analysis of typical channels in which customers directly interact with your company (calls, chats, emails, feedback, surveys, etc.) but all the channels in which customers may not be interacting directly with you – social, reviews, blogs, comment boards, media, etc.

CX1

In order to understand the purpose of a CX team and how it operates, you first need to understand how most businesses organize, manage, and carry out their customer experiences today.

Essentially, a company’s customer experience is owned and managed by a handful of teams. This includes, but is not limited to:

  • digital,
  • brand,
  • strategy,
  • UX,
  • retail,
  • design,
  • pricing,
  • membership,
  • logistics,
  • marketing,
  • and customer service.

All of these teams have a hand in customer experience.

In order to affirm that they are working towards a common goal, they must

  1. communicate in a timely manner,
  2. meet and discuss upcoming initiatives and projects,
  3. and discuss results along with future objectives.

In a perfect world, every team has the time and passion to accomplish these tasks to ensure the customer experience is in sync with their work. In reality, teams end up scrambling for information and understanding of how each business function is impacting the customer experience – sometimes after the CX program has already launched.

CX2

This process is extremely inefficient and can lead to serious problems across the customer experience. These problems can lead to irreparable financial losses. If business functions are not on the same page when launching an experience, it creates a broken one for customers. Siloed teams create siloed experiences.

There are plenty of companies that operate in a semi-siloed manner and feel it is successful. What these companies don’t understand is that customer experience issues often occur between the ownership of these silos, in what some refer to as the “customer experience abyss,” where no business function claims ownership. Customers react to these broken experiences by communicating their frustration through different communication channels (chats, surveys, reviews, calls, tweets, posts etc.).

For example, if a company launches a new subscription service and customers are confused about the pricing model, is it the job of customer service to explain it to customers?  What about those customers that don’t contact the business at all? Does marketing need to modify their campaigns? Maybe digital needs to edit the nomenclature online… It could be all of these things. The key is determining which will solve the poor customer experience.

The objective of a CX program is to focus deeply on what customers are saying and shift business teams to become advocates for what they say. Once advocacy is achieved, the customer experience can be improved at scale with speed and precision. A premium customer experience is the key to company growth and customer retention. How important is the customer experience?

You may be saying to yourself, “We already have teams examining our customer data, no
need to establish a new team to look at it.” While this may be true, the teams are likely taking a siloed approach to analyzing customer data by only investigating the portion of the data they own.

For example, the social team looks at social data, the digital team analyzes web feedback and analytics, the marketing team reviews surveys and performs studies, etc. Seldom do these teams come together and combine their data to get a holistic view of the customer. Furthermore, when it comes to prioritizing CX improvements, they do so based on an incomplete view of the customer.

Consolidating all customer data gives a unified view of your customers while lessening the workload and increasing the rate at which insights are generated. The experience customers have with marketing, digital, and customer service, all lead to different interactions. Breaking these interactions into different, separate components is the reason companies struggle with understanding the true customer experience and miss the big picture on how to improve it.

The CX team, once established, will be responsible for creating a unified view of the customer which will provide the company with an unbiased understanding of how customers feel about their experiences as well as their expectations of the industry. These insights will provide awareness, knowledge, and curiosity that will empower business functions to improve the end-to-end customer experience.

CX programs are disruptive. A successful CX program will uncover insights that align with current business objectives and some insights that don’t at all. So, what do you do when you run into that stone wall? How do you move forward when a business function refuses to adopt the voice of the customer? Call in back-up from an executive who understands the value of the voice of the customer and why it needs to be top-of mind for every function.

When creating a disruptive program like CX, an executive owner is needed to overcome business hurdles along the way. Ideally, this executive owner will support the program and promote it to the broader business functions. In order to scale and become more widely adopted, it is also helpful to have executive support when the program begins.

The best candidates for initial ownership are typically marketing, analytics or operations executives. Along with understanding the value a CX program can offer, they should also understand the business’ current data landscape and help provide access to these data sets. Once the CX team has access to all the available customer data, it will be able to aggregate all necessary interactions.

Executive sponsors will help dramatically in regard to CX program adoption and eventual scaling. Executive sponsors

  • can provide the funding to secure the initial success,
  • promote the program to ensure other business functions work closer to the program,
  • and remove roadblocks that may otherwise take weeks to get over.

Although an executive sponsor is not necessary, it can make your life exponentially easier while you build, launch, and execute your CX program. Your customers don’t always tell you what you want to hear, and that can be difficult for some business functions to handle. When this is the case, some business functions will try to discredit insights altogether if they don’t align with their goals.

Data grows exponentially every year, faster than any company can manage. In 2016, 90% of the world’s data had been created in the previous two years. 80% of that data was unstructured language. The hype of “Big Data” has passed and the focus is now on “Big Insights” – how to manage all the data and make it useful. A company should not be allocating resources to collecting more data through expensive surveys or market research – instead, they should be focused on doing a better job of listening and reacting to what customers are already saying, by unifying the voice of the customer with data that is already readily available.

It’s critical to identify all the available customer interactions and determine value and richness. Be sure to think about all forms of direct and indirect interactions customers have. This includes:

CX3

These channels are just a handful of the most popular avenues customers use to engage with brands. Your company may have more, less, or none of these. Regardless, the focus should be on aggregating as many as possible to create a holistic view of the customer. This does not mean only aggregating your phone calls and chats; this includes every channel where your customers talk with, at, or about your company. You can’t be selective when it comes to analyzing your customers by channel. All customers are important, and they may have different ways of communicating with you.

Imagine if someone only listened to their significant other in the two rooms where they spend the most time, say the family room and kitchen. They would probably have a good understanding of the overall conversations (similar to a company only reviewing calls, chats, and social). However, ignoring them in the dining room, bedroom, kids’ rooms, and backyard, would inevitably lead to serious communication problems.

It’s true that phone, chat, and social data is extremely rich, accessible, and popular, but that doesn’t mean you should ignore other customers. Every channel is important. Each is used by a different customer, in a different manner, and serves a different purpose, some providing more context than others.

You may find your most important customers aren’t always the loudest and may be interacting with you through an obscure channel you never thought about. You need every customer channel to fully understand their experience.

Click here to access Topbox’s detailed study

Mastering Financial Customer Data at Multinational Scale

Your Customer Data…Consolidated or Chaotic?

In an ideal world, you know your customers. You know

  • who they are,
  • what business they transact,
  • who they transact with,
  • and their relationships.

You use that information to

  • calculate risk,
  • prevent fraud,
  • uncover new business opportunities,
  • and comply with regulatory requirements.

The problem at most financial institutions is that customer data environments are highly chaotic. Customer data is stored in numerous systems across the company. Most, if not all of which, has evolved over time in siloed environments according to business function. Each system has its

  • own management team,
  • technology platform,
  • data models,
  • quality issues,
  • and access policies.

Tamr1

This chaos prevents the firms from fully achieving and maintaining a consolidated view of customers and their activity.

The Cost of Chaos

A chaotic customer data environment can be an expensive problem in a financial institution. Customer changes have to be implemented in multiple systems, with a high likelihood of error or inconsistency because of manual processes. Discrepancies with the data leads to inevitable remediation activities that are widespread, and costly.

Analyzing customer data within one global bank required three months to compile and validate its correctness. The chaos leads to either

  1. prohibitively high time and cost of data preparation or
  2. garbage-in, garbage-out analytics.

The result of customer data chaos is an incredibly high risk profile — operational, regulatory, and reputational.

Eliminating the Chaos 1.0

Many financial services companies attempt to eliminate this chaos and consolidate their customer data.

A common approach is to implement a master data management (MDM) system. Customer data from different source systems is centralized into one place where it can be harmonized. The output is a “golden record,” or master customer record.

A lambda architecture permits data to stream into the centralized store and be processed in realtime so that it is immediately mastered and ready for use. Batch processes run on the centralized store to perform periodic (daily, monthly, quarterly, etc.) calculations on the data.

First-generation MDM systems centralize customer data and unify it by writing ETL scripts and matching rules.

Tamr2

The harmonizing often involves:

  1. Defining a common, master schema in which to store the consolidated data
  2. Writing ETL scripts to transform the data from source formats and schemas into the new common storage format
  3. Defining rule sets to deduplicate, match/cluster, and otherwise cleanse within the central MDM store

There are a number of commercial MDM solutions available that support the deterministic approach outlined above. The initial experience with those MDM systems, integrating the first five or so large systems, is often positive. Scaling MDM to master more and more systems, however, becomes a challenge that grows exponentially, as we’ll explain below.

Rules-based MDM, and the Robustness- Versus-Expandability Trade Off

The rule sets used to harmonize data together are usually driven off of a handful of dependent attributes—name, legal identifiers, location, and so on. Let’s say you use six attributes to stitch together four systems, A and B, and then the same six attributes between A and C, then A and D, B and C, B and D, and C and D. Within that example of 4 systems, you would have twenty four potential attributes that you are aligning. Add a fifth system, it’s 60 attributes; a sixth system, 90 attributes. So the effort to master additional systems grows exponentially. And in most multinational financial institutions, the number of synchronized attributes is not six; it’s commonly 50 to 100.

And maintenance is equally burdensome. There’s no guarantee that your six attributes maintain their validity or veracity over time. If any of these attributes need to be modified, then rules need to be redefined across the systems all over again.

The trade off for many financial institutions is robustness versus expandability. In other words, you can have a large-scale data mastering implementation and have it wildly complex, or you can do something small and have it highly accurate.

This is problematic for most financial institutions, which have very large-scale customer data challenges.

Customer Data Mastering at Scale

In larger financial services companies, especially multinationals, the number of systems in which customer data resides is much larger than the examples above. It is not uncommon to see financial companies with over 100 large systems.

Among those are systems that have been:

  • Duplicated in many countries to comply with data sovereignty regulations
  • Acquired via inorganic growth, purchased companies bringing in their own infrastructure for trading, CRM, HR, and back office. Integrating these can take a significant amount of time and cost

tamr3

When attempting to master a hundred sources containing petabytes of data, all of which have data linking and matching in different ways across a multitude of attributes and systems, you can see that the matching rules required to harmonize your data together gets incredibly complex.

Every incremental source added to the MDM environment can take thousands of rules to be implemented. Within just a mere handful of systems, the complexity gets to a point where it’s unattainable. As that complexity goes up, the cost of maintaining a rules-based approach also scales wildly, requiring more and more data stewards to make sure all the stitching rules remain correct.

Mastering data at scale is one of the riskiest endeavors a business can take. Gartner reports that 85% of MDM projects fail. And MDM budgets of $10M to $20M per year are not uncommon in large multinationals. With such high stakes, making sure that you get the right approach is critical to making sure that this thing is a success.

A New Take on an Old Paradigm

What follows is a reference architecture. The approach daisy chains together three large tool sets, each with appropriate access policies enforced, that are responsible for three separate steps in the mastering process:

  1. Raw Data Zone
  2. Common Data Zone
  3. Mastered Data Zone

tamr4

Raw Data Zone The first sits on a traditional data lake model—a landing area for raw data. Data is replicated from source systems to the centralized data repository (often built on Hadoop). Data is replicated in real time (perhaps via Kafka) wherever possible so that data is most up to date. For source systems that do not support real-time replication, nightly batch jobs or flat-file ingestion are used.

Common Data Zone Within the Common Data Zone, we take all of the data from the Raw Zone—with the various different objects, in different shapes and sizes, and conform that into outputs that look and feel the same to the system, with the same column headers, data types, and formats.

The toolset in this zone utilizes machine learning models to categorize data that exists within the Raw Data Zone. Machine learning models are trained on what certain attributes look like—what’s a legal entity, or a registered address, or country of incorporation, or legal hierarchy, or any other field. It does so without requiring anyone having to go back to the source system owners to bog them down with questions about that, saving weeks of effort.

This solution builds up a taxonomy and schema for the conformed data as raw data is processed. Unlike early-generation MDM solutions, this substantially reduces data unification time, often by months per source system, because there is:

  • No need to pre-define a schema to hold conformed data
  • No need to write ETL to transform the raw data

One multinational bank implementing this reference architecture reported being able to conform the raw data from a 10,000-table system within three days, and without using up source systems experts’ time defining a schema or writing ETL code. In terms of figuring out where relevant data is located in the vast wilderness this solution is very productive and predictable.

Mastered Data Zone In the third zone, the conformed data is mastered, and the outputs of the mastering process are clusters of records that refer to the same real-world entity. Within each cluster, a single, unified golden, master record of the entity is configured. The golden customer record is then distributed to wherever it’s needed:

  • Data warehouses
  • Regulatory (KYC, AML) compliance systems
  • Fraud and corruption monitoring
  • And back to operational systems, to keep data changes clean at the source

As with the Common Zone, machine learning models are used. These models eliminate the need to define hundreds of rules to match and deduplicate data. Tamr’s solution applies a probabilistic model that uses statistical analysis and naive Bayesian modeling to learn from existing relationships between various attributes, and then makes record-matching predictions based on these attribute relationships.

Tamr matching models require training, which usually takes just a few days per source system. Tamr presents a data steward with its predictions, and the steward can either confirm or deny them to help Tamr perfect its matching.

With the probabilistic model, Tamr looks at all of the attributes on which it has been trained, and based on the attribute matching, the solution will indicate a confidence level of a match being accurate. Depending on a configurable confidence level threshold, It will disregard entries that fall below the threshold from further analysis and training.

As you train Tamr and correct it, it becomes more accurate over time. The more data you throw at te solution, the better it gets. Which is a stark contrast to the rules-based MDM approach, where the more data you throw at it, it tends to break because the rules can’t keep up with the level of complexity.

Distribution A messaging bus (e.g., Apache Kafka) is often used to distribute mastered customer data throughout the organization. If a source system wants to pick up the master copy from the platform, it subscribes to that topic on the messaging bus to receive the feed of changes.

Another approach is to pipeline deltas from the MDM platform into target system in batch.

Real-world Results

This data mastering architecture is in production at a number of large financial institutions. Compared with traditional MDM approaches, the model-driven approach provides the following advantages:

70% fewer IT resources required:

  • Humans in the entity resolution loop are much more productive, focused on a relatively small percentage (~5%) of exceptions that the machine learning algorithms cannot resolve
  • Eliminates ETL and matching rules development
  • Reduces manual data synchronization and remediation of customer data across systems

Faster customer data unification:

  • A global retail bank mastered 35 large IT systems within 6 months—about 4 days per source system
  • New data is mastered within 24 hours of landing in the Raw Data Zone
  • A platform for mastering any category of data—customer, product, suppler, and others

Faster, more complete achievement of data-driven business initiatives:

  • KYC, AML, fraud detection, risk analysis, and others.


Click here to access Tamr’s detailed analysistamr4

Building your data and analytics strategy

When it comes to being data-driven, organizations run the gamut with maturity levels. Most believe that data and analytics provide insights. But only one-third of respondents to a TDWI survey said they were truly data-driven, meaning they analyze data to drive decisions and actions.

Successful data-driven businesses foster a collaborative, goal-oriented culture. Leaders believe in data and are governance-oriented. The technology side of the business ensures sound data quality and puts analytics into operation. The data management strategy spans the full analytics life cycle. Data is accessible and usable by multiple people – data engineers and data scientists, business analysts and less-technical business users.

TDWI analyst Fern Halper conducted research of analytics and data professionals across industries and identified the following five best practices for becoming a data-driven organization.

1. Build relationships to support collaboration

If IT and business teams don’t collaborate, the organization can’t operate in a data-driven way – so eliminating barriers between groups is crucial. Achieving this can improve market performance and innovation; but collaboration is challenging. Business decision makers often don’t think IT understands the importance of fast results, and conversely, IT doesn’t think the business understands data management priorities. Office politics come into play.

But having clearly defined roles and responsibilities with shared goals across departments encourages teamwork. These roles should include: IT/architecture, business and others who manage various tasks on the business and IT sides (from business sponsors to DevOps).

2. Make data accessible and trustworthy

Making data accessible – and ensuring its quality – are key to breaking down barriers and becoming data-driven. Whether it’s a data engineer assembling and transforming data for analysis or a data scientist building a model, everyone benefits from trustworthy data that’s unified and built around a common vocabulary.

As organizations analyze new forms of data – text, sensor, image and streaming – they’ll need to do so across multiple platforms like data warehouses, Hadoop, streaming platforms and data lakes. Such systems may reside on-site or in the cloud. TDWI recommends several best practices to help:

  • Establish a data integration and pipeline environment with tools that provide federated access and join data across sources. It helps to have point-and-click interfaces for building workflows, and tools that support ETL, ELT and advanced specifications like conditional logic or parallel jobs.
  • Manage, reuse and govern metadata – that is, the data about your data. This includes size, author, database column structure, security and more.
  • Provide reusable data quality tools with built-in analytics capabilities that can profile data for accuracy, completeness and ambiguity.

3. Provide tools to help the business work with data

From marketing and finance to operations and HR, business teams need self-service tools to speed and simplify data preparation and analytics tasks. Such tools may include built-in, advanced techniques like machine learning, and many work across the analytics life cycle – from data collection and profiling to monitoring analytical models in production.

These “smart” tools feature three capabilities:

  • Automation helps during model building and model management processes. Data preparation tools often use machine learning and natural language processing to understand semantics and accelerate data matching.
  • Reusability pulls from what has already been created for data management and analytics. For example, a source-to-target data pipeline workflow can be saved and embedded into an analytics workflow to create a predictive model.
  • Explainability helps business users understand the output when, for example, they’ve built a predictive model using an automated tool. Tools that explain what they’ve done are ideal for a data-driven company.

4. Consider a cohesive platform that supports collaboration and analytics

As organizations mature analytically, it’s important for their platform to support multiple roles in a common interface with a unified data infrastructure. This strengthens collaboration and makes it easier for people to do their jobs.

For example, a business analyst can use a discussion space to collaborate with a data scientist while building a predictive model, and during testing. The data scientist can use a notebook environment to test and validate the model as it’s versioned and metadata is captured. The data scientist can then notify the DevOps team when the model is ready for production – and they can use the platform’s tools to continually monitor the model.

5. Use modern governance technologies and practices

Governance – that is, rules and policies that prescribe how organizations protect and manage their data and analytics – is critical in learning to trust data and become data-driven. But TDWI research indicates that one-third of organizations don’t govern their data at all. Instead, many focus on security and privacy rules. Their research also indicates that fewer than 20 percent of organizations do any type of analytics governance, which includes vetting and monitoring models in production.

Decisions based on poor data – or models that have degraded – can have a negative effect on the business. As more people across an organization access data and build  models, and as new types of data and technologies emerge (big data, cloud, stream mining), data governance practices need to evolve. TDWI recommends three features of governance software that can strengthen your data and analytics governance:

  • Data catalogs, glossaries and dictionaries. These tools often include sophisticated tagging and automated procedures for building and keeping catalogs up to date – as well as discovering metadata from existing data sets.
  • Data lineage. Data lineage combined with metadata helps organizations understand where data originated and track how it was changed and transformed.
  • Model management. Ongoing model tracking is crucial for analytics governance. Many tools automate model monitoring, schedule updates to keep models current and send alerts when a model is degrading.

In the future, organizations may move beyond traditional governance council models to new approaches like agile governance, embedded governance or crowdsourced governance.

But involving both IT and business stakeholders in the decision-making process – including data owners, data stewards and others – will always be key to robust governance at data-driven organizations.

SAS1

There’s no single blueprint for beginning a data analytics project – never mind ensuring a successful one.

However, the following questions help individuals and organizations frame their data analytics projects in instructive ways. Put differently, think of these questions as more of a guide than a comprehensive how-to list.

1. Is this your organization’s first attempt at a data analytics project?

When it comes to data analytics projects, culture matters. Consider Netflix, Google and Amazon. All things being equal, organizations like these have successfully completed data analytics projects. Even better, they have built analytics into their cultures and become data-driven businesses.

As a result, they will do better than neophytes. Fortunately, first-timers are not destined for failure. They should just temper their expectations.

2. What business problem do you think you’re trying to solve?

This might seem obvious, but plenty of folks fail to ask it before jumping in. Note here how I qualified the first question with “do you think.” Sometimes the root cause of a problem isn’t what we believe it to be; in other words, it’s often not what we at first think.

In any case, you don’t need to solve the entire problem all at once by trying to boil the ocean. In fact, you shouldn’t take this approach. Project methodologies (like agile) allow organizations to take an iterative approach and embrace the power of small batches.

3. What types and sources of data are available to you?

Most if not all organizations store vast amounts of enterprise data. Looking at internal databases and data sources makes sense. Don’t make the mistake of believing, though, that the discussion ends there.

External data sources in the form of open data sets (such as data.gov) continue to proliferate. There are easy methods for retrieving data from the web and getting it back in a usable format – scraping, for example. This tactic can work well in academic environments, but scraping could be a sign of data immaturity for businesses. It’s always best to get your hands on the original data source when possible.

Caveat: Just because the organization stores it doesn’t mean you’ll be able to easily access it. Pernicious internal politics stifle many an analytics endeavor.

4. What types and sources of data are you allowed to use?

With all the hubbub over privacy and security these days, foolish is the soul who fails to ask this question. As some retail executives have learned in recent years, a company can abide by the law completely and still make people feel decidedly icky about the privacy of their purchases. Or, consider a health care organization – it may not technically violate the Health Insurance Portability and Accountability Act of 1996 (HIPAA), yet it could still raise privacy concerns.

Another example is the GDPR. Adhering to this regulation means that organizations won’t necessarily be able to use personal data they previously could use – at least not in the same way.

5. What is the quality of your organization’s data?

Common mistakes here include assuming your data is complete, accurate and unique (read: nonduplicate). During my consulting career, I could count on one hand the number of times a client handed me a “perfect” data set. While it’s important to cleanse your data, you don’t need pristine data just to get started. As Voltaire said, “Perfect is the enemy of good.”

6. What tools are available to extract, clean, analyze and present the data?

This isn’t the 1990s, so please don’t tell me that your analytic efforts are limited to spreadsheets. Sure, Microsoft Excel works with structured data – if the data set isn’t all that big. Make no mistake, though: Everyone’s favorite spreadsheet program suffers from plenty of limitations, in areas like:

  • Handling semistructured and unstructured data.
  • Tracking changes/version control.
  • Dealing with size restrictions.
  • Ensuring governance.
  • Providing security.

For now, suffice it to say that if you’re trying to analyze large, complex data sets, there are many tools well worth exploring. The same holds true for visualization. Never before have we seen such an array of powerful, affordable and user-friendly tools designed to present data in interesting ways.

Caveat 1: While software vendors often ape each other’s features, don’t assume that each application can do everything that the others can.

Caveat 2: With open source software, remember that “free” software could be compared to a “free” puppy. To be direct: Even with open source software, expect to spend some time and effort on training and education.

7. Do your employees possess the right skills to work on the data analytics project?

The database administrator may well be a whiz at SQL. That doesn’t mean, though, that she can easily analyze gigabytes of unstructured data. Many of my students need to learn new programs over the course of the semester, and the same holds true for employees. In fact, organizations often find that they need to:

  • Provide training for existing employees.
  • Hire new employees.
  • Contract consultants.
  • Post the project on sites such as Kaggle.
  • All of the above.

Don’t assume that your employees can pick up new applications and frameworks 15 minutes at a time every other week. They can’t.

8. What will be done with the results of your analysis?

A company routinely spent millions of dollars recruiting MBAs at Ivy League schools only to see them leave within two years. Rutgers MBAs, for their part, stayed much longer and performed much better.

Despite my findings, the company continued to press on. It refused to stop going to Harvard, Cornell, etc. because of vanity. In his own words, the head of recruiting just “liked” going to these schools, data be damned.

Food for thought: What will an individual, group, department or organization do with keen new insights from your data analytics projects? Will the result be real action? Or will a report just sit in someone’s inbox?

9. What types of resistance can you expect?

You might think that people always and willingly embrace the results of data-oriented analysis. And you’d be spectacularly wrong.

Case in point: Major League Baseball (MLB) umpires get close ball and strike calls wrong more often than you’d think. Why wouldn’t they want to improve their performance when presented with objective data? It turns out that many don’t. In some cases, human nature makes people want to reject data and analytics that contrast with their world views. Years ago, before the subscription model became wildly popular, some Blockbuster executives didn’t want to believe that more convenient ways to watch movies existed.

Caveat: Ignore the power of internal resistance at your own peril.

10. What are the costs of inaction?

Sure, this is a high-level query and the answers depend on myriad factors.

For instance, a pharma company with years of patent protection will respond differently than a startup with a novel idea and competitors nipping at its heels. Interesting subquestions here include:

  • Do the data analytics projects merely confirm what we already know?
  • Do the numbers show anything conclusive?
  • Could we be capturing false positives and false negatives?

Think about these questions before undertaking data analytics projects Don’t take the queries above as gospel. By and large, though, experience proves that asking these questions frames the problem well and sets the organization up for success – or at least minimizes the chance of a disaster.

SAS2

Most organizations understand the importance of data governance in concept. But they may not realize all the multifaceted, positive impacts of applying good governance practices to data across the organization. For example, ensuring that your sales and marketing analytics relies on measurably trustworthy customer data can lead to increased revenue and shorter sales cycles. And having a solid governance program to ensure your enterprise data meets regulatory requirements could help you avoid penalties.

Companies that start data governance programs are motivated by a variety of factors, internal and external. Regardless of the reasons, two common themes underlie most data governance activities: the desire for high-quality customer information, and the need to adhere to requirements for protecting and securing that data.

What’s the best way to ensure you have accurate customer data that meets stringent requirements for privacy and security?

For obvious reasons, companies exert significant effort using tools and third-party data sets to enforce the consistency and accuracy of customer data. But there will always be situations in which the managed data set cannot be adequately synchronized and made consistent with “real-world” data. Even strictly defined and enforced internal data policies can’t prevent inaccuracies from creeping into the environment.

sas3

Why you should move beyond a conventional approach to data governance?

When it comes to customer data, the most accurate sources for validation are the customers themselves! In essence, every customer owns his or her information, and is the most reliable authority for ensuring its quality, consistency and currency. So why not develop policies and methods that empower the actual owners to be accountable for their data?

Doing this means extending the concept of data governance to the customers and defining data policies that engage them to take an active role in overseeing their own data quality. The starting point for this process fits within the data governance framework – define the policies for customer data validation.

A good template for formulating those policies can be adapted from existing regulations regarding data protection. This approach will assure customers that your organization is serious about protecting their data’s security and integrity, and it will encourage them to actively participate in that effort.

Examples of customer data engagement policies

  • Data protection defines the levels of protection the organization will use to protect the customer’s data, as well as what responsibilities the organization will assume in the event of a breach. The protection will be enforced in relation to the customer’s selected preferences (which presumes that customers have reviewed and approved their profiles).
  • Data access control and security define the protocols used to control access to customer data and the criteria for authenticating users and authorizing them for particular uses.
  • Data use describes the ways the organization will use customer data.
  • Customer opt-in describes the customers’ options for setting up the ways the organization can use their data.
  • Customer data review asserts that customers have the right to review their data profiles and to verify the integrity, consistency and currency of their data. The policy also specifies the time frame in which customers are expected to do this.
  • Customer data update describes how customers can alert the organization to changes in their data profiles. It allows customers to ensure their data’s validity, integrity, consistency and currency.
  • Right-to-use defines the organization’s right to use the data as described in the data use policy (and based on the customer’s selected profile options). This policy may also set a time frame associated with the right-to-use based on the elapsed time since the customer’s last date of profile verification.

The goal of such policies is to establish an agreement between the customer and the organization that basically says the organization will protect the customer’s data and only use it in ways the customer has authorized – in return for the customer ensuring the data’s accuracy and specifying preferences for its use. This model empowers customers to take ownership of their data profile and assume responsibility for its quality.

Clearly articulating each party’s responsibilities for data stewardship benefits both the organization and the customer by ensuring that customer data is high-quality and properly maintained. Better yet, recognize that the value goes beyond improved revenues or better compliance.

Empowering customers to take control and ownership of their data just might be enough to motivate self-validation.

Click her to access SAS’ detailed analysis

Data Search and Discovery in Insurance – An Overview of AI Capabilities

Historically, the insurance industry has collected vast amounts of data relevant to their customers, claims, and so on. This can be unstructured data in the form of PDFs, text documents, images, and videos, or structured data that has been organized for big data analytics.

As with other industries, the existence of such a trove of data in the insurance industry led many of the larger firms to adopt big data analytics and techniques to find patterns in the data that might reveal insights that drive business value.

Any such big data applications may require several steps of data management, including collection, cleansing, consolidation, and storage. Insurance firms that have worked with some form of big data analytics in the past might have access to structured data which can be ingested by AI algorithms with little additional effort on the part of data scientists.

The insurance industry might be ripe for AI applications due to the availability of vast amounts of historical data records and the existence of large global companies with the resources to implement complex AI projects. The data being collected by these companies comes from several channels and in different formats, and AI search and discovery projects in the space require several initial steps to organize and manage data.

Radim Rehurek, who earned his PhD in Computer Science from the Masaryk University Brno and founded RARE Technologies, points out:

« A majority of the data that insurance firms collect is likely unstructured to some degree. This poses several challenges to insurance companies in terms of collecting and structuring data, which is key to the successful implementation of AI systems. »

Giacomo Domeniconi, a post-doctoral researcher at IBM Watson TJ Research Center and Adjunct Professor for the course “High-Performance Machine Learning” at New York University, mentions structuring the data as the largest challenge for businesses:

“Businesses need to structure their information and create labeled datasets, which can be used to train the AI system. Yet creating this labeled dataset might be very challenging apply AI and in most cases would involve manually labeling a part of the data using the expertise of a specialist in the domain.”

Businesses face many challenges in terms of collecting and structuring their data, which is key to the successful implementation of AI systems. An AI application is only as good as the data it consumes.

Natural language processing (NLP) and machine learning models often need to be trained on large volumes of data. Data scientists tweak these models to improve their accuracy.

This is a process that might last several months from start to finish, even in cases where the model is being taught relatively rudimentary tasks, such as identifying semantic trends in an insurance company’s internal documentation.

Most AI systems necessarily require the data to be input into an AI system in a structured format. Businesses would need to collect, clean, and organize their data to meet these requirements.

Although creating NLP and machine learning models to solve real-world business problems is by itself a challenging task, this process cannot be started without a plan for organizing and structuring enough data for these models to operate at reasonable accuracy levels.

Large insurance firms might need to think about how their data at different physical locations across the world might be affected by local data regulations or differences in data storage legacy systems at each location. Even with all the data being made accessible, businesses would find that data might still need to be scrubbed to remove any incorrect, incomplete, improperly formatted, duplicate, or outlying data. Businesses would also find that in some cases regulations might mandate the signing of data sharing agreements between the involved parties or data might need to be moved to locations where it can be analyzed. Since the data is highly voluminous, moving the data accurately can prove to be a challenge by itself.

InsIA

Click here to access Iron Mountain – Emerj’s White Paper


Integrating Finance, Risk and Regulatory Reporting (FRR) through Comprehensive Data Management

Data travels faster than ever, anywhere and all the time. Yet as fast as it moves, it has barely been able to keep up with the expanding agendas of financial supervisors. You might not know it to look at them, but the authorities in Basel, Washington, London, Singapore and other financial and political centers are pretty swift themselves when it comes to devising new requirements for compiling and reporting data. They seem to want nothing less than a renaissance in the way institutions organize and manage their finance, risk and regulatory reporting activities.

The institutions themselves might want the same thing. Some of the business strategies and tactics that made good money for banks before the global financial crisis have become unsustainable and cut into their profitability. More stringent regulator frameworks imposed since the crisis require the implementation of complex, data-intensive stress testing procedures and forecasting models that call for unceasing monitoring and updating. The days of static reports capturing a moment in a firm’s life are gone. One of the most challenging data management burdens is rooted in duplication. The evolution of regulations has left banks with various bespoke databases across five core functions:

  • credit,
  • treasury,
  • profitability analytics,
  • financial reporting
  • and regulatory reporting,

with the same data inevitably appearing and processed in multiple places. This hodgepodge of bespoke marts simultaneously leads to both the duplication of data and processes, and the risk of inconsistencies – which tend to rear their head at inopportune moments (i.e. when consistent data needs to be presented to regulators). For example,

  • credit extracts core loan, customer and credit data;
  • treasury pulls core cash flow data from all instruments;
  • profitability departments pull the same instrument data as credit and treasury and add ledger information for allocations;
  • financial reporting pulls ledgers and some subledgers for reporting;
  • and regulatory reporting pulls the same data yet again to submit reports to regulators per prescribed templates.

The ever-growing list of considerations has compelled firms to revise, continually and on the fly, not just how they manage their data but how they manage their people and basic organizational structures. An effort to integrate activities and foster transparency – in particular through greater cooperation among risk and finance – has emerged across financial services. This often has been in response to demands from regulators, but some of the more enlightened leaders in the industry see it as the most sensible way to comply with supervisory mandates and respond to commercial exigencies, as well. Their ability to do that has been constrained by the variety, frequency and sheer quantity of information sought by regulators, boards and senior executives. But that is beginning to change as a result of new technological capabilities and, at least as important, new management strategies. This is where the convergence of Finance, Risk and Regulatory Reporting (FRR) comes in. The idea behind the FRR theme is that sound regulatory compliance and sound business analytics are manifestations of the same set of processes. Satisfying the demands of supervisory authorities and maximizing profitability and competitiveness in the marketplace involve similar types of analysis, modeling and forecasting. Each is best achieved, therefore, through a comprehensive, collaborative organizational structure that places the key functions of finance, risk and regulatory reporting at its heart.

The glue that binds this entity together and enables it to function as efficiently and cost effectively as possible – financially and in the demands placed on staff – is a similarly comprehensive and unified FRR data management. The right architecture will permit data to be drawn upon from all relevant sources across an organization, including disparate legacy hardware and software accumulated over the years in silos erected for different activities ad geographies. Such an approach will reconcile and integrate this data and present it in a common, consistent, transparent fashion, permitting it to be deployed in the most efficient way within each department and for every analytical and reporting need, internal and external.

The immense demands for data, and for a solution to manage it effectively, have served as a catalyst for a revolutionary development in data management: Regulatory Technology, or RegTech. The definition is somewhat flexible and tends to vary with the motivations of whoever is doing the defining, but RegTech basically is the application of cutting-edge hardware, software, design techniques and services to the idiosyncratic challenges related to financial reporting and compliance. The myriad advances that fall under the RegTech rubric, such as centralized FRR or RegTech data management and analysis, data mapping and data visualization, are helping financial institutions to get out in front of the stringent reporting requirements at last and accomplish their efforts to integrate finance, risk and regulatory reporting duties more fully, easily and creatively.

A note of caution though: While new technologies and new thinking about how to employ them will present opportunities to eliminate weaknesses that are likely to have crept into the current architecture, ferreting out those shortcomings may be tricky because some of them will be so ingrained and pervasive as to be barely recognizable. But it will have to be done to make the most of the systems intended to improve or replace existing ones.

Just what a solution should encompass to enable firms to meet their data management objectives depends on the

  • specifics of its business, including its size and product lines,
  • the jurisdictions in which it operates,
  • its IT budget
  • and the tech it has in place already.

But it should accomplish three main goals:

  1. Improving data lineage by establishing a trail for each piece of information at any stage of processing
  2. Providing a user-friendly view of the different processing step to foster transparency
  3. Working together seamlessly with legacy systems so that implementation takes less time and money and imposes less of a burden on employees.

The two great trends in financial supervision – the rapid rise in data management and reporting requirements, and the demands for greater organizational integration – can be attributed to a single culprit: the lingering silo structure. Fragmentation continues to be supported by such factors as a failure to integrate the systems of component businesses after a merger and the tendency of some firms to find it more sensible, even if it may be more costly and less efficient in the long run, to install new hardware and software whenever a new set of rules comes along. That makes regulators – the people pressing institutions to break down silos in the first place – inadvertently responsible for erecting new barriers.

This bunker mentality – an entrenched system of entrenchment – made it impossible to recognize the massive buildup of credit difficulties that resulted in the global crisis. It took a series of interrelated events to spark the wave of losses and insolvencies that all but brought down the financial system. Each of them might have appeared benign or perhaps ominous but containable when taken individually, and so the occupants of each silo, who could only see a limited number of the warning signs, were oblivious to the extent of the danger. More than a decade has passed since the crisis began, and many new supervisory regimens have been introduced in its aftermath. Yet bankers, regulators and lawmakers still feel the need, with justification, to press institutions to implement greater organizational integration to try to forestall the next meltdown. That shows how deeply embedded the silo system is in the industry.

Data requirements for the development that, knock on wood, will limit the damage from the next crisis – determining what will happen, rather than identifying and explaining what has already happened – are enormous. The same goes for running an institution in a more integrated way. It’s not just more data that’s needed, but more kinds of data and more reliable data. A holistic, coordinated organizational structure, moreover, demands that data be analyzed at a higher level to reconcile the massive quantities and types of information produced within each department. And institutions must do more than compile and sort through all that data. They have to report it to authorities – often quarterly or monthly, sometimes daily and always when something is flagged that could become a problem. Indeed, some data needs to be reported in real time. That is a nearly impossible task for a firm still dominated by silos and highlights the need for genuinely new design and implementation methods that facilitate the seamless integration of finance, risk and regulatory reporting functions. Among the more data-intensive regulatory frameworks introduced or enhanced in recent years are:

  • IFRS 9 Financial Instruments and Current Expected Credit Loss. The respective protocols of the International Accounting Standards Board and Financial Accounting Standards Board may provide the best examples of the forwardthinking approach – and rigorous reporting, data management and compliance procedures – being demanded. The standards call for firms to forecast credit impairments to assets on their books in near real time. The incurred-loss model being replaced merely had banks present bad news after the fact. The number of variables required to make useful forecasts, plus the need for perpetually running estimates that hardly allow a chance to take a breath, make the standards some of the most data-heavy exercises of all.
  • Stress tests here, there and everywhere. Whether for the Federal Reserve’s Comprehensive Capital Analysis and Review (CCAR) for banks operating in the United States, the Firm Data Submission Framework (FDSF) in Britain or Asset Quality Reviews, the version conducted by the European Banking Authority (EBA) for institutions in the euro zone, stress testing has become more frequent and more free-form, too, with firms encouraged to create stress scenarios they believe fit their risk profiles and the characteristics of their markets. Indeed, the EBA is implementing a policy calling on banks to conduct stress tests as an ongoing risk management procedure and not merely an assessment of conditions at certain discrete moments.
  • Dodd-Frank Wall Street Reform and Consumer Protection Act. The American law expands stress testing to smaller institutions that escape the CCAR. The act also features extensive compliance and reporting procedures for swaps and other over-the-counter derivative contracts.
  • European Market Infrastructure Regulation. Although less broad in scope than Dodd-Frank, EMIR has similar reporting requirements for European institutions regarding OTC derivatives.
  • AnaCredit, Becris and FR Y-14. The European Central Bank project, known formally as the Analytical Credit Dataset, and its Federal Reserve equivalent for American banks, respectively, introduce a step change in the amount and granularity of data that needs to be reported. Information on loans and counterparties must be reported contract by contract under AnaCredit, for example. Adding to the complication and the data demands, the European framework permits national variations, including some with particularly rigorous requirements, such as the Belgian Extended Credit Risk Information System (Becris).
  • MAS 610. The core set of returns that banks file to the Monetary Authority of Singapore are being revised to require information at a far more granular level beginning next year. The number of data elements that firms have to report will rise from about 4,000 to about 300,000.
  • Economic and Financial Statistics Review (EFS). The Australian Prudential Authority’s EFS Review constitutes a wide-ranging update to the regulator’s statistical data collection demands. The sweeping changes include requests for more granular data and new forms in what would be a three-phase implementation spanning two years, requiring parallel and trial periods running through 2019 and beyond.

All of those authorities, all over the world, requiring that much more information present a daunting challenge, but they aren’t the only ones demanding that finance, risk and regulatory reporting staffs raise their games. Boards, senior executives and the real bosses – shareholders – have more stringent requirements of their own for profitability, capital efficiency, safety and competitiveness. Firms need to develop more effective data management and analysis in this cause, too.

The critical role of data management was emphasized and codified in Document 239 of the Basel Committee on Banking Supervision (BCBS), “Principles for Effective Risk Data Aggregation and Risk Reporting.” PERDARR, as it has come to be called in the industry, assigns data management a central position in the global supervisory architecture, and the influence of the 2013 paper can be seen in mandates far and wide. BCBS 239 explicitly linked a bank’s ability to gauge and manage risk with its ability to function as an integrated, cooperative unit rather than a collection of semiautonomous fiefdoms. The process of managing and reporting data, the document makes clear, enforces the link and binds holistic risk assessment to holistic operating practices. The Basel committee’s chief aim was to make sure that institutions got the big picture of their risk profile so as to reveal unhealthy concentrations of exposure that might be obscured by focusing on risk segment by segment. Just in case that idea might escape some executive’s notice, the document mentions the word “aggregate,” in one form or another, 86 times in the 89 ideas, observations, rules and principles it sets forth.

The importance of aggregating risks, and having data management and reporting capabilities that allow firms to do it, is spelled out in the first of these: ‘One of the most significant lessons learned from the global financial crisis that began in 2007 was that banks’ information technology (IT) and data architectures were inadequate to support the broad management of financial risks. Many banks lacked the ability to aggregate risk exposures and identify concentrations quickly and accurately at the bank group level, across business lines and between legal entities. Some banks were unable to manage their risks properly because of weak risk data aggregation capabilities and risk reporting practices. This had severe consequences to the banks themselves and to the stability of the financial system as a whole.’

If risk data management was an idea whose time had come when BCBS 239 was published five years ago, then RegTech should have been the means to implement the idea. RegTech was being touted even then, or soon after, as a set of solutions that would allow banks to increase the quantity and quality of the data they generate, in part because RegTech itself was quantitatively and qualitatively ahead of the hardware and software with which the industry had been making do. There was just one ironic problem: Many of the RegTech solutions on the market at the time were highly specialized and localized products and services from small providers. That encouraged financial institutions to approach data management deficiencies gap by gap, project by project, perpetuating the compartmentalized, siloed thinking that was the scourge of regulators and banks alike after the global crisis. The one-problem-at-a-time approach also displayed to full effect another deficiency of silos: a tendency for work to be duplicated, with several departments each producing the same information, often in different ways and with different results. That is expensive and time consuming, of course, and the inconsistencies that are likely to crop up make the data untrustworthy for regulators and for executives within the firm that are counting on it.

Probably the most critical feature of a well thought-out solution is a dedicated, focused and central FRR data warehouse that can chisel away at the barriers between functions, even at institutions that have been slow to abandon a siloed organizational structure reinforced with legacy systems.

FRR

With :

  • E : Extract
  • L : Load
  • T : Transform Structures
  • C : Calculations
  • A : Aggregation
  • P : Presentation


Click here to access Wolters Kluwer’s White Paper


Front Office Risk Management Technology

A complex tangle of embedded components

Over the past three decades, Front Office Risk Management (FORM) has developed in a piecemeal way. As a result of historical business drivers and the varying needs of teams focused on different products within banks, FORM systems were created for individual business silos, products and trading desks. Typically, different risk components and systems were entwined and embedded within trading systems and transaction processing platforms, and ran on different analytics, trade capture and data management technology. As a result, many banks now have multiple, varied and overlapping FORM systems.

Increasingly, however, FORM systems are emerging as a fully fledged risk solution category, rather than remaining as embedded components inside trading systems or transactional platforms (although those components still exist). For many institutions FORM, along with the frontoffice operating environment, has fundamentally changed following the global financial crisis of 2008. Banks are now dealing with a wider environment of systemically reduced profitability in which cluttered and inefficient operating models are no longer sustainable, and there are strong cost pressures for them to simplify their houses.

Equally, a more stringent and prescriptive regulatory environment is having significant direct and indirect impacts on front-office risk technology. Because of regulators’ intense scrutiny of banks’ capital management, the front office is continuously and far more acutely aware of its capital usage (and cost), and this is having a fundamental impact on the way the systems it uses are evolving. The imperative for risk-adjusted pricing means that traditional trading systems are struggling to cope with the growing importance of and demand for Valuation Adjustment (xVA) systems at scale. Meanwhile, regulations such as the Fundamental Review of the Trading Book (FRTB) will have profound implications for frontoffice risk systems.

As a result of these direct and indirect regulatory pressures, several factors are changing the frontoffice risk technology landscape:

  • The scale and complexity involved in data management.
  • Requirements for more computational power.
  • The imperative for integration and consistency with middle-office risk systems.

Evolving to survive

As banks recognize the need for change, FORM is slowly but steadily evolving. Banks can no longer put off upgrades to systems that were built for a different era, and consensus around the need for a flexible, cross-asset, externalized front-office risk system has emerged.

Over the past few years, most Tier 1 and Tier 2 banks have started working toward the difficult goal of

  • standardizing,
  • consolidating
  • and externalizing

their risk systems, extracting them from trading and transaction processing platforms (if that’s where they existed). These efforts are complicated by the nature of FORM – specifically that it cuts across several functional areas.

Vendors, meanwhile, are struggling with the challenges of meeting the often contradictory nature of front-office demands (such as the need for flexibility vs. scalability). As the frontoffice risk landscape shifts under the weight of all these demand-side changes, many leading vendors have been slow to adapt to the significant competitive challenges. Not only are they dealing with competition from new market entrants with different business models, in many instances they are also playing catch-up with more innovative Tier 1 banks. What’s more, the willingness to experiment and innovate with front-office risk systems is now filtering down to Tier 2s and smaller institutions across the board. Chartis is seeing an increase in ‘build and buy’ hybrid solutions that leverage open-source and open-HPC2 infrastructure.

The rapid development of new technologies is radically altering the dynamics of the market, following several developments:

  • A wave of new, more focused tools.
  • Platforms that leverage popular computational paradigms.
  • Software as a Service (SaaS) risk systems.

More often than not, incumbent vendors are failing to harness the opportunities that these technologies and new open-source languages bring, increasing the risk that they could become irrelevant within the FORM sector. Chartis contends that, as the market develops, the future landscape will be dominated by a combination of agile new entrants and existing players that can successfully transform their current offerings. Vendors have many different strategies in evidence, but the evolution required for them to survive and flourish has only just begun.

With that in mind, we have outlined several recommendations for vendors seeking to stay relevant in the new front-office risk environment:

  • Above all, focus on an open, flexible environment.
  • Create consistent risk data and risk factor frameworks.
  • Develop highly standardized interfaces.
  • Develop matrices and arrays as ‘first-class constructs’.
  • Embrace open-source languages and ecosystems.
  • Consider options such as partnerships and acquisitions to acquire the requisite new skills and technology capabilities in a relatively short period of time.

Chartis

Click here to access Chartis’ Vendor Spotlight Report