Benchmarking digital risk factors facing financial service firms

Risk management is the foundation upon which financial institutions are built. Recognizing risk in all its forms—measuring it, managing it, mitigating it—are all critical to success. But has every firm achieved that goal? It doesn’t take indepth research beyond the myriad of breach headlines to answer that question.

But many important questions remain: What are key dimensions of the financial sector Internet risk surface? How does that surface compare to other sectors? Which specific industries within Financial Services appear to be managing that risk better than others? We take up these questions and more in this report.

  1. The financial sector boasts the lowest rate of high and critical security exposures among all sectors. This indicates they’re doing a good job managing risk overall.
  2. But not all types of financial service firms appear to be managing risk equally well. For example, the rate of severe findings in the smallest commercial banks is 4x higher than that of the largest banks.
  3. It’s not just small community banks struggling, however. Securities and Commodities firms show a disconcerting combination of having the largest deployment of high-value assets AND the highest rate of critical security exposures.
  4. Others appear to be exceeding the norm. Take credit card issuers: they typically have the largest Internet footprint but balance that by maintaining the lowest rate of security exposures.
  5. Many other challenges and risk factors exist. For instance, the industry average rate of severe security findings in critical cloud-based assets is 3.5x that of assets hosted on-premises.

Dimensions of the Financial Sector Risk Surface

As Digital Transformation ushers in a plethora of changes, critical areas of risk exposure are also changing and expanding. We view the risk surface as anywhere an organization’s ability to operate, reputation, assets, legal obligations, or regulatory compliance is at risk. The aspects of a firm’s risk exposure that are associated with or observable from the internet are considered its internet risk surface. In Figure 1, we compare five key dimensions of the internet risk surface across different industries and highlight where the financial sector ranks among them.

  • Hosts: Number of internet-facing assets associated with an organization.
  • Providers: Number of external service providers used across hosts.
  • Geography: Measure of the geographic distribution of a firm’s hosts.
  • Asset Value: Rating of the data sensitivity and business criticality of hosts based on multiple observed indicators. High value systems that include those that collect GDPR and CCPA regulated information.
  • Findings: Security-relevant issues that expose hosts to various threats, following the CVSS rating scale.

TR1

The values recorded in Figure 1 for these dimensions represent what’s “typical” (as measured by the mean or median) among organizations within each sector. There’s a huge amount of variation, meaning not all financial institutions operate more external hosts than all realtors, but what you see here is the general pattern. The blue highlights trace the ranking of Finance along each dimension.

Financial firms are undoubtedly aware of these tendencies and the need to protect those valuable assets. What’s more, that awareness appears to translate fairly effectively into action. Finance boasts the lowest rate of high and critical security exposures among all sectors. We also ran the numbers specific to high-value assets, and financial institutions show the lowest exposure rates there too. All of this aligns pretty well with expectations—financial firms keep a tight rein on their valuable Internet-exposed assets.

This control tendency becomes even more apparent when examining the distribution of hosts with severe findings in Figure 2. Blue dots mark the average exposure rate for the entire sector (and correspond to values in Figure 1), while the grey bars indicate the amount of variation among individual organizations within each sector. The fact that Finance exhibits the least variation shows that even rotten apples don’t fall as far from the Finance tree as they often do in other sectors. Perhaps a rising tide lifts all boats?

TR2

Security Exposures in Financial Cloud Deployments

We now know financial institutions do well minimizing security findings, but does that record stand equally strong across all infrastructure? Figure 3 answers that question by featuring four of the five key risk surface dimensions:

  • the proportion of hosts (square size),
  • asset value (columns),
  • hosting location (rows),
  • and the rate of severe security findings (color scale and value label).

This view facilitates a range of comparisons, including the relative proportion of assets hosted internally vs. in the cloud, how asset value distributes across hosting locales, and where high-severity issues accumulate.

TR3

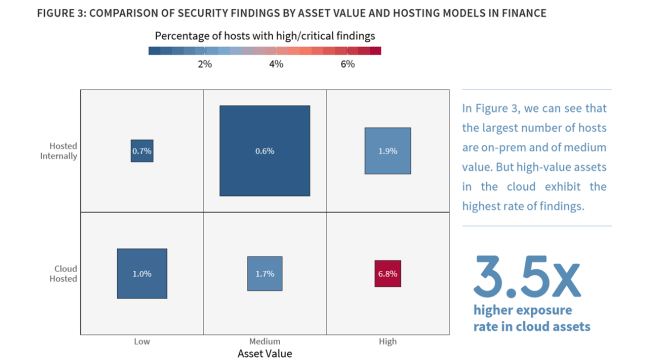
From Figure 3, box sizes indicate that organizations in the financial sector host a majority of their Internet-facing systems on-premises, but do leverage the cloud to a greater degree for low-value assets. The bright red box makes it apparent that security exposures concentrate more acutely in high-value assets hosted in the cloud. Overall, the rate of severe findings in cloud-based assets is 3.5x that of on-prem. This suggests the angst many financial firms have over moving to the cloud does indeed have some merit. But when we examine the Finance sector relative to others in Figure 4 the intensity of exposures in critical cloud assets appears much less drastic.

In Figure 3, we can see that the largest number of hosts are on-prem and of medium value. But high-value assets in the cloud exhibit the highest rate of findings.

Given that cloud vs. on-prem exposure disparity, we feel the need to caution against jumping to conclusions. We could interpret these results to proclaim that the cloud isn’t ready for financial applications and should be avoided. Another interpretation could suggest that it’s more about organizational readiness for the cloud than the inherent insecurity of the cloud. Either way, it appears that many financial institutions migrating to the cloud are handling that paradigm shift better than others.

It must also be noted that not all cloud environments are the same. Our Cloud Risk Surface report discovered an average 12X difference between cloud providers with the highest and lowest exposure rates. We still believe this says more about the typical users and use cases of the various cloud platforms than any intrinsic security inequalities. But at the same time, we recommend evaluating cloud providers based on internal features as well as tools and guidance they make available to assist customers in securing their environments. Certain clouds are undoubtedly a better match for financial services use cases while others less so.

TR4

Risk Surface of Subsectors within Financial Services

Having compared Finance to other sectors at a high level, we now examine the risk surface of major subsectors of financial services according to the following NAICS designations:

  • Insurance Carriers: Institutions engaged in underwriting and selling annuities, insurance policies, and benefits.
  • Credit Intermediation: Includes banks, savings institutions, credit card issuers, loan brokers, and processors, etc.
  • Securities & Commodities: Investment banks, brokerages, securities exchanges, portfolio management, etc.
  • Central Banks: Monetary authorities that issue currency, manage national money supply and reserves, etc.
  • Funds & Trusts: Funds and programs that pool securities or other assets on behalf of shareholders or beneficiaries.

TR5

Figure 5 compares these Finance subsectors along the same dimensions used in Figure 1. At the top, we see that Insurance Carriers generally maintain a large Internet surface area (hosts, providers, countries), but a comparatively lower ranking for asset value and security findings. The Credit Intermediation subsector (the NAICS designation that includes banks, brokers, creditors, and processors) follows a similar pattern. This indicates that such organizations are, by and large, able to maintain some level of control over their expanding risk surface.

A leading percentage of high-value assets and a leading percentage of highly critical security findings for the Securities and Commodities subsector is a disconcerting combination. It suggests either unusually high risk tolerance or ineffective risk management (or both), leaving those valuable assets overexposed. The Funds and Trusts subsector exhibits a more riskaverse approach to minimizing exposures across its relatively small digital footprint of valuable assets.

Risk Surface across Banking Institutions

Given that the financial sector is so broad, we thought a closer examination of the risk surface particular to banking institutions was in order. Banks have long concerned themselves with risk. Well before the rise of the Internet or mobile technologies, banks made their profits by determining how to gauge the risk of potential borrowers or loans, plotting the risk and reward of offering various deposit and investment products, or entering different markets, allowing access through several delivery channels. It could be said that the successful management and measurement of risk throughout an organization is perhaps the key factor that has always determined the relative success or failure of any bank.

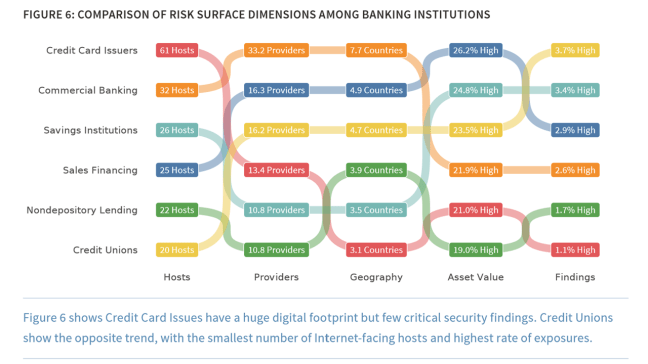
As a highly-regulated industry in most countries, banking institutions must also consider risk from more than a business or operational perspective. They must take into account the compliance requirements to limit risk in various areas, and ensure that they are properly securing their systems and services in a way that meets regulatory standards. Such pressures undoubtedly affect the risk surface and Figure 6 hints at those effects on different types of banking institutions.

Credit card issuers earn the honored distinction of having the largest average number of Internet-facing hosts (by far) while achieving the lowest prevalence of severe security findings. Credit unions flip this trend with the fewest hosts and most prevalent findings. This likely reflects the perennial struggle of credit unions to get the most bang from their buck.

Traditionally well-resourced commercial banks leverage the most third party providers and have a presence in more countries, all with a better-than-average exposure rate. Our previous research revealed that commercial banks were among the top two generators and receivers of multi-party cyber incidents, possibly due to the size and spread of their risk surface.

TR6

Two Things to Consider

  1. In this interconnected world, third-party and fourth-party risk is your risk. If you are a financial institution, particularly a commercial bank, take a moment to congratulate yourself on managing risk well – but only for a moment. Why? Because every enterprise is critically dependent on a wide array of vendors and partners that span a broad spectrum of industries. Their risk is your risk. The work of your third-party risk team is critically important in holding your vendors accountable to managing your risk interests well.
  2. Managing risk—whether internal or third-party—requires focus. There are simply too many things to do, giving rise to the endless “hamster wheel of risk management.” A better approach starts with obtaining an accurate picture of your risk surface and the critical exposures across it. This includes third-party relationships, and now fourth-party risk, which bank regulators are now requiring. Do you have the resources to sufficiently manage this? Do you know your risk surface?

Click here to access Riskrecon Cyentia’s Study

Banks sailing in uncertain waters

The decision-making process apparent paradox

Corporate decision-making processes are driven by seemingly opposing forces.

On the  one hand, the human urge to dispose of instruments emerges in order

  • to understand context, specific self-direction
  • and to implement the actions required for following the plotted course.

On the other hand, the exhortation to keep the mind open

  • to an array of possible future scenarios,
  • to imagine and grasp the implications of the various possible trajectories,
  • to plot alternative courses according to the obstacles and opportunities encountered, that could lead to landing places other than those contemplated originally.

Needs that are intertwined as never before whenever the decision-maker operates in an area such as the banking sector, that is characterised by extremely pervasive regulatory requirements concerning the

  • maintenance and use of capital,
  • liquidity management,
  • checks on lending and distribution policies,

and that is structurally exposed to the volatility of the macroeconomic context and financial markets, greatly increasing the range of possible scenarios.

Thus, it is far from surprising or infrequent that one of the most common questions that CEOs ask the technical structures responsible for budgeting and risk planning is: ‘what if’? (‘what would happen if…?’). The problem is that, in the last few years, the ‘ifs’ at hand have rapidly multiplied, as there has been an exponential increase in the controlling variables for which feedback is required:

  • Net Interest Income (NII);
  • Cost Income ratio (C/I);
  • Return On Equity (ROE);
  • Non Performing Exposure (NPE) Ratio;
  • Liquidity Coverage Ratio (LCR);
  • Expected Credit Loss (ECL);
  • Common Equity Tier 1 (CET1) ratio,

to cite but a few among the most widespread. Planning has turned into an interdisciplinary and convoluted exercise, an issue hard to solve for CFOs and CROs in particular (naturally, should they not operate in close cooperation).

This greater complexity can result in the progressive loss of quality of the banks’ decision-making process, more often than not based on an incomplete information framework, whenever some controlling variables are unavailable, or even incorrect when there is an actual lack of information, specialist expertise and/or the instruments required for the modelling of events.

Partial mitigating circumstances include the fact that such events, aside from being numerous, are interdependent in their impact on the bank’s results and are particularly heterogeneous. These can in fact be exogenous (turbulence and interference along the way) or endogenous (the actions that the helmsman and the crew implement during navigation).

In the first case, these events are beyond the control of those responsible for the decision-making process, determined by the evolution of the market conditions and/or the choices of institutional subjects. As such, they are often hard to predict in their likelihood of occurrence, intensity, timing and duration. By nature, such phenomena are characterised by complex interactions, that make it crucial, albeit arduous, to comprehend the cause-effect mechanisms governing them. Lastly, their relevance is not absolute, but relative, in that it depends on the degree of reactivity of the bank’s business model and budgetary structure to the single risk factors to which the market value of the banks’ assets is exposed.

Conversely, in the case of endogenous events, uncertainty is more correlated to the ability of the bank’s top management

  • to quantify the level of ambition of the business actions,
  • to assess their multiple implications,
  • and specifically, to the bank’s actual ability to implement them within requested time frames and terms.

The taxonomy of banking strategic planning

Although these complexities are increasingly obvious, many banks still remain convinced about getting started on their respective courses with certainty, exposing themselves to a range of risks that can restrict or irreversibly compromise the efficacy of the decision-making processes. Some institutions are indeed persuaded that an ‘expert-based’ approach that has always characterised their planning methodologies shall continue to be sufficient and appropriate for steering the bank, also in future.

History teaches us that things have not always worked out that way. These actors have yet to understand that it has now become vital to foster the evolution of the planning process towards a model relying upon analytical methodologies and highly sophisticated and technological instruments (risk management, econometrics, statistics, financial engineering, …), making them available to those that have always considered experience, business knowledge and budgetary dynamics to be privileged instruments for making decisions.

Second mistake: many banks believe the uncertainty analysis to be wasteful and redundant for the purposes of planning since, ultimately, the allocation of objectives is (and will remain) based on assumptions and uniquely identified scenarios. In this case, the risk lies in failing to understand that, in actual fact, a broader analysis of possible scenarios contributes to better delineating the assigned objectives, by separating the external conditions from the contribution provided by internal actions. Moreover, testing various hypotheses and combinations of cases makes it easier to calibrate the ‘level of managerial ambition’, in line with the actual potential of the organisational structure and with the full involvement of the business functions responsible for attaining the corporate objectives.

The intersection of these two misreadings of the context results in a different positioning of the bank, with the relative risks and opportunities.

Models

ILLUMINATED

The planning process is built upon analytical data and models developed with the contribution of subject matter experts of different origins, which allows to consider the impacts of a specific scenario on the bank’s budget simultaneously and coherently. Nevertheless, not only does it improve the planning of a specific item, but it disposes of appropriate instruments to switch to a multi-scenario perspective and investigate the relevant scenarios for management, appraising the volatility regarding the expected results. This transition is extremely delicate: it entails a change in the way prospective information is produced by the technical functions and subsequently channelled to the top management and board of directors. In this context, the bank is governed via the analysis of deterministic scenarios and the statistical analysis of the probability distributions of the variables of interest. Leveraging this set of information (much more abundant and articulated than the traditional one) targets, risk propensity levels and relative alert and tolerance thresholds are established; business owners are provided not only with the final objectives, but also with details concerning the key risk factors (endogenous and exogenous alike) that might represent critical or success factors and the respective probabilities of occurrence.

DELUDED

The budget planning process is characterised by the prevalence of an expert-based approach (with a limited capacity of integrating quantitative models and methodologies, in that not always all budget items are developed by relying on the necessary instruments and expertise) and aimed at forecasting a single baseline scenario (the one under which the budget objectives are to be formalised, then articulated on the organisational units and business combinations).

ENLIGHTENED

The budgetary planning process is very accurate and incorporates specialist expertise (often cross-functional) required to understand and transmit the interactions across the managerial phenomena so as to ensure a full grasp of the bank’s ongoing context. The onus is chiefly on the ability to explain the phenomena inside the bank without prejudice to the external baseline scenario, that is ‘given’ by definition.

MISSING

The planning process attempts to consider the impact of alternative scenarios as compared to the baseline scenario, however, it is implemented on the basis of imprecise or incomplete modelling, in that developed without the analytical foundations and instruments required to appraise the consistency and the degree of likelihood of these scenarios, useful tools to sustain such a serious consideration. The focus remains on the comparison across the results produced under diverse conditions, while taking into account the approximations used.

Click here to access Prometeia’s white paper

The future of compliance – How cognitive computing is transforming the banking industry

Paradigm shift in financial services regulatory compliance

The compliance landscape has changed rapidly and dramatically over the past 15 years, with the volume and complexity of new regulations rising unabated. Financial institutions have strained to keep pace with the onslaught of legislative and regulatory changes that arose in response to improper business practices and criminal activity. These changes caused the erosion of public confidence in global credit and financial markets and in the security of our banking system.

After the financial crisis of 2008, there was a sharp increase in enforcement actions brought by federal and state regulators in a broad range of cases involving financial and securities fraud, economic sanctions violations, money laundering, bribery, corruption, market manipulation, and tax evasion, leading to violations of the Bank Secrecy Act and OFAC sanctions1 According to Forbes, Inc., aggregate fines paid by the largest global banks from 2008 through August 2014 exceeded USD 250 billion. A February 2016 report issued by Bloomberg revealed that the toll on foreign banks since the 2008 crisis has been colossal with 100,000 jobs lost, USD 63 billion in fines and penalties, and a staggering USD 420 billion dollar loss in market capitalization.

In the wake of these enforcement actions and record-breaking penalties, financial institutions are under pressure to

  • rethink,
  • restructure,
  • and retool

their risk and compliance function to operate in the current environment. With regulators, investors and boards demanding increased global transparency, risk and compliance can no longer be tackled in geographical silos. Transforming the way compliance departments operate to meet the new reality requires an investment in talent and technology.

Spending on talent continues to rise as institutions hire more and more staff to shore up already sizeable compliance teams. At the end of 2014, Citigroup reported a compliance staff of 30,000. Some boards, analysts, and investors question the exploding costs of compliance yet recognize that any effort to reduce staff without demonstrable and measureable improvements in compliance processes and technology would almost certainly be viewed negatively by regulators. Headcount alone cannot solve today’s compliance challenges. One possible solution lies in transformative technology that enables a shift in the focus of compliance staff from that of information gatherers to information analyzers. In other words, it is time for a paradigm shift in the financial services industry and the way regulatory compliance departments operate.

Cognitive computing for compliance

Cognitive systems are trained by humans and learn as they ingest and interpret new information. Rather than being explicitly programmed, they learn and reason from their interactions with us and from their experiences with their environment. IBM® Watson® technology represents a new era in computing called cognitive computing, where systems understand the world in a way more similar to humans: through

  • senses,
  • learning
  • and experience.

Watson

  • uses natural language processing to analyze structured and unstructured data,
  • uses natural language processing to understand grammar and context,
  • understands complex questions
  • and proposes evidence-based answers,

based on supporting evidence and the quality of information found.

Cognitive computing is a natural fit for the regulatory compliance space because it can be used to accomplish the significant amount of analysis required to read and interpret regulations. The traditional process of distilling regulations into distinct requirements is a demanding and continuous undertaking. Compliance professionals must read hundreds of regulatory documents and determine which of the thousands of lines of text constitute true requirements. Given the same document to assess, different staff can arrive at different conclusions. In a manual environment, this adds another layer of issues to track while the parties resolve whether the identified text is or is not a requirement.

This work is usually performed on a continuous cycle and under the pressure of deadlines. The end-to-end process of identifying and finalizing the requirements inventory can be demanding and tedious. It is also traditionally encumbered by the heavy use of spreadsheets for tracking of regulations, requirements, internal decisions and statuses. Together, these conditions have the potential to negatively impact the work environment and can result in low morale and high turnover. Only when the human effort can shift from the tedium of manual processes (collect regulations, identify requirements, and track compliance issues through spreadsheets) to an automated solution will end-to-end visibility and transparency be realized. Cognitive computing technology can help an institution realign its approach from outdated information processing techniques to a state-of-the-art solution that enables this transformation.

IBM Watson Regulatory Compliance puts the power of cognitive computing into the hands of compliance professionals, giving them the capabilities needed to leverage data to help them manage risk and compliance requirements, and optimize data for more effective analysis. It is specifically tailored for compliance departments and offers, or in the future may offer, core functionalities that include:

  • Document ingestion
  • Requirements parsing and identification
  • Requirements decisioning and management
  • Categorization of requirements
  • Mapping of controls to requirements
  • Harmonization of risk frameworks
  • Interactive reporting and analytics
  • Automated audit trail
  • Automated requirements catalog
  • Centralized document library

Watson Regulatory Compliance is designed to help organizations use cognitive technology to transform key portions of their regulatory compliance processes that are traditionally performed manually.

IBM Cognitive

These enhancements, enabled by Watson, can potentially help an organization to reallocate resources to more value-added compliance and analytic activities for improved transparency across the compliance function.

A conceptual end-to-end approach for cognitive compliance and requirement management, to categorization, mapping of controls and standards, and analytics and reporting is presented in the following figure.

IBM Cognitive 2

Click here to access IBM’s White Paper