The Big Tech In Quantum Report: How Google, Microsoft, Amazon, IBM, & Intel Are Battling For The Future Of Computing

Summary Of Findings
Overview of big tech’s activities in quantum
Big tech’s quantum activity is ramping up quickly

  • Google, Microsoft, Amazon, IBM, and Intel are all developing their own quantum computing hardware. Big tech companies have been behind several breakthroughs in the space.
  • In July 2021, Microsoft’s venture arm took part in a $450M round to PsiQuantum—the most well-funded quantum computing startup in the world.

Cloud is a key area of quantum competition for big tech

  • Google, Microsoft, Amazon, and IBM have all launched quantum computing services on their cloud platforms.
  • Startups have partnered with big tech companies to offer remote access to a broad range of quantum computers.

What’s next?

  • Big tech forges ahead with quantum advances. Google, Microsoft, Amazon, IBM, and Intel all have ambitious quantum roadmaps.
  • Expect rising qubit counts and more frequent demonstrations of commercial applications.


Watch for quantum computing to become a hot geopolitical issue, especially for US-China relations.

  • Expect big tech companies, including China-based Baidu and Alibaba, to be drawn deeper into political debates.
  • In the US, government efforts to rein in big tech could be countered by officials nervous about keeping up with countries racing ahead with quantum technology.


Other big tech players could join the fray.

Facebook and Apple have not announced quantum tech initiatives, but both will be monitoring the space and have business lines that could benefit from quantum computing.


THEME #1: GOOGLE IS BUILDING CUTTING-EDGE QUANTUM TECHNOLOGY

Alphabet has a software-focused quantum team called Sandbox that is dedicated to applying quantum technology to near-term enterprise use cases. Sandbox operates mostly in stealth mode; however, recent job postings and past comments from its leadership indicate that its work includes:

  • Quantum sensors —There are hints that Sandbox is working on a hypersensitive magnetism-based diagnostic imaging platform, possibly an MEG system for reading brain activity, that combines quantum-based sensitivity gains (tens of thousands of times more sensitive than typical approaches) with quantum machine learning to disentangle a signal from background noise to boost sensitivity. This could allow for more precise scans or for cheaper, more flexible deployments of magnetic-based imaging devices for use beyond hospital settings, as well as improved access in lower-income countries.
  • Post-quantum cryptography (PQC)—Quantum computers threaten much of the encryption used on the internet. Post-quantum cryptography will defend against this. Expect Sandbox’s work to be focused on helping enterprises transition to PQC and making Alphabet’s sprawling online services quantum-safe.
  • Distributed computing —This tech allows computers to coordinate processing power and work together on problems. Sandbox’s work here may focus on integrating near-term quantum computers into distributed computing networks to boost overall capabilities. Another approach would be to use quantum optimization algorithms to help manage distributed networks more efficiently.

THEME #2: GOOGLE HAS MADE SCIENTIFIC BREAKTHROUGHS

THEME #3: GOOGLE COULD BENEFIT FROM A QUANTUM AI RIPPLE EFFECT

THEME #1: MICROSOFT IS POSITIONING ITSELF AS AN EARLY QUANTUM CLOUD LEADER

THEME #2: MICROSOFT WANTS ITS OWN QUANTUM HARDWARE

THEME #3: MICROSOFT IS A POST-QUANTUM CRYPTOGRAPHY PIONEER

THEME #1: AMAZON SEES QUANTUM COMPUTERS AS KEY TO THE FUTURE OF AWS

THEME #2: AMAZON IS DEVELOPING ITS OWN QUANTUM HARDWARE

THEME #3: AMAZON’S CURRENT BUSINESS LINES COULD BE GIVEN A BIG BOOST BY QUANTUM COMPUTERS

THEME #1: IBM IS GOING AFTER THE FULL QUANTUM COMPUTING STACK

THEME #2: IBM POSITIONS ITSELF AS THE ESSENTIAL QUANTUM COMPUTING PARTNER FOR ENTERPRISES

Benchmarking digital risk factors facing financial service firms

Risk management is the foundation upon which financial institutions are built. Recognizing risk in all its forms—measuring it, managing it, mitigating it—are all critical to success. But has every firm achieved that goal? It doesn’t take indepth research beyond the myriad of breach headlines to answer that question.

But many important questions remain: What are key dimensions of the financial sector Internet risk surface? How does that surface compare to other sectors? Which specific industries within Financial Services appear to be managing that risk better than others? We take up these questions and more in this report.

  1. The financial sector boasts the lowest rate of high and critical security exposures among all sectors. This indicates they’re doing a good job managing risk overall.
  2. But not all types of financial service firms appear to be managing risk equally well. For example, the rate of severe findings in the smallest commercial banks is 4x higher than that of the largest banks.
  3. It’s not just small community banks struggling, however. Securities and Commodities firms show a disconcerting combination of having the largest deployment of high-value assets AND the highest rate of critical security exposures.
  4. Others appear to be exceeding the norm. Take credit card issuers: they typically have the largest Internet footprint but balance that by maintaining the lowest rate of security exposures.
  5. Many other challenges and risk factors exist. For instance, the industry average rate of severe security findings in critical cloud-based assets is 3.5x that of assets hosted on-premises.

Dimensions of the Financial Sector Risk Surface

As Digital Transformation ushers in a plethora of changes, critical areas of risk exposure are also changing and expanding. We view the risk surface as anywhere an organization’s ability to operate, reputation, assets, legal obligations, or regulatory compliance is at risk. The aspects of a firm’s risk exposure that are associated with or observable from the internet are considered its internet risk surface. In Figure 1, we compare five key dimensions of the internet risk surface across different industries and highlight where the financial sector ranks among them.

  • Hosts: Number of internet-facing assets associated with an organization.
  • Providers: Number of external service providers used across hosts.
  • Geography: Measure of the geographic distribution of a firm’s hosts.
  • Asset Value: Rating of the data sensitivity and business criticality of hosts based on multiple observed indicators. High value systems that include those that collect GDPR and CCPA regulated information.
  • Findings: Security-relevant issues that expose hosts to various threats, following the CVSS rating scale.

TR1

The values recorded in Figure 1 for these dimensions represent what’s “typical” (as measured by the mean or median) among organizations within each sector. There’s a huge amount of variation, meaning not all financial institutions operate more external hosts than all realtors, but what you see here is the general pattern. The blue highlights trace the ranking of Finance along each dimension.

Financial firms are undoubtedly aware of these tendencies and the need to protect those valuable assets. What’s more, that awareness appears to translate fairly effectively into action. Finance boasts the lowest rate of high and critical security exposures among all sectors. We also ran the numbers specific to high-value assets, and financial institutions show the lowest exposure rates there too. All of this aligns pretty well with expectations—financial firms keep a tight rein on their valuable Internet-exposed assets.

This control tendency becomes even more apparent when examining the distribution of hosts with severe findings in Figure 2. Blue dots mark the average exposure rate for the entire sector (and correspond to values in Figure 1), while the grey bars indicate the amount of variation among individual organizations within each sector. The fact that Finance exhibits the least variation shows that even rotten apples don’t fall as far from the Finance tree as they often do in other sectors. Perhaps a rising tide lifts all boats?

TR2

Security Exposures in Financial Cloud Deployments

We now know financial institutions do well minimizing security findings, but does that record stand equally strong across all infrastructure? Figure 3 answers that question by featuring four of the five key risk surface dimensions:

  • the proportion of hosts (square size),
  • asset value (columns),
  • hosting location (rows),
  • and the rate of severe security findings (color scale and value label).

This view facilitates a range of comparisons, including the relative proportion of assets hosted internally vs. in the cloud, how asset value distributes across hosting locales, and where high-severity issues accumulate.

TR3

From Figure 3, box sizes indicate that organizations in the financial sector host a majority of their Internet-facing systems on-premises, but do leverage the cloud to a greater degree for low-value assets. The bright red box makes it apparent that security exposures concentrate more acutely in high-value assets hosted in the cloud. Overall, the rate of severe findings in cloud-based assets is 3.5x that of on-prem. This suggests the angst many financial firms have over moving to the cloud does indeed have some merit. But when we examine the Finance sector relative to others in Figure 4 the intensity of exposures in critical cloud assets appears much less drastic.

In Figure 3, we can see that the largest number of hosts are on-prem and of medium value. But high-value assets in the cloud exhibit the highest rate of findings.

Given that cloud vs. on-prem exposure disparity, we feel the need to caution against jumping to conclusions. We could interpret these results to proclaim that the cloud isn’t ready for financial applications and should be avoided. Another interpretation could suggest that it’s more about organizational readiness for the cloud than the inherent insecurity of the cloud. Either way, it appears that many financial institutions migrating to the cloud are handling that paradigm shift better than others.

It must also be noted that not all cloud environments are the same. Our Cloud Risk Surface report discovered an average 12X difference between cloud providers with the highest and lowest exposure rates. We still believe this says more about the typical users and use cases of the various cloud platforms than any intrinsic security inequalities. But at the same time, we recommend evaluating cloud providers based on internal features as well as tools and guidance they make available to assist customers in securing their environments. Certain clouds are undoubtedly a better match for financial services use cases while others less so.

TR4

Risk Surface of Subsectors within Financial Services

Having compared Finance to other sectors at a high level, we now examine the risk surface of major subsectors of financial services according to the following NAICS designations:

  • Insurance Carriers: Institutions engaged in underwriting and selling annuities, insurance policies, and benefits.
  • Credit Intermediation: Includes banks, savings institutions, credit card issuers, loan brokers, and processors, etc.
  • Securities & Commodities: Investment banks, brokerages, securities exchanges, portfolio management, etc.
  • Central Banks: Monetary authorities that issue currency, manage national money supply and reserves, etc.
  • Funds & Trusts: Funds and programs that pool securities or other assets on behalf of shareholders or beneficiaries.

TR5

Figure 5 compares these Finance subsectors along the same dimensions used in Figure 1. At the top, we see that Insurance Carriers generally maintain a large Internet surface area (hosts, providers, countries), but a comparatively lower ranking for asset value and security findings. The Credit Intermediation subsector (the NAICS designation that includes banks, brokers, creditors, and processors) follows a similar pattern. This indicates that such organizations are, by and large, able to maintain some level of control over their expanding risk surface.

A leading percentage of high-value assets and a leading percentage of highly critical security findings for the Securities and Commodities subsector is a disconcerting combination. It suggests either unusually high risk tolerance or ineffective risk management (or both), leaving those valuable assets overexposed. The Funds and Trusts subsector exhibits a more riskaverse approach to minimizing exposures across its relatively small digital footprint of valuable assets.

Risk Surface across Banking Institutions

Given that the financial sector is so broad, we thought a closer examination of the risk surface particular to banking institutions was in order. Banks have long concerned themselves with risk. Well before the rise of the Internet or mobile technologies, banks made their profits by determining how to gauge the risk of potential borrowers or loans, plotting the risk and reward of offering various deposit and investment products, or entering different markets, allowing access through several delivery channels. It could be said that the successful management and measurement of risk throughout an organization is perhaps the key factor that has always determined the relative success or failure of any bank.

As a highly-regulated industry in most countries, banking institutions must also consider risk from more than a business or operational perspective. They must take into account the compliance requirements to limit risk in various areas, and ensure that they are properly securing their systems and services in a way that meets regulatory standards. Such pressures undoubtedly affect the risk surface and Figure 6 hints at those effects on different types of banking institutions.

Credit card issuers earn the honored distinction of having the largest average number of Internet-facing hosts (by far) while achieving the lowest prevalence of severe security findings. Credit unions flip this trend with the fewest hosts and most prevalent findings. This likely reflects the perennial struggle of credit unions to get the most bang from their buck.

Traditionally well-resourced commercial banks leverage the most third party providers and have a presence in more countries, all with a better-than-average exposure rate. Our previous research revealed that commercial banks were among the top two generators and receivers of multi-party cyber incidents, possibly due to the size and spread of their risk surface.

TR6

Two Things to Consider

  1. In this interconnected world, third-party and fourth-party risk is your risk. If you are a financial institution, particularly a commercial bank, take a moment to congratulate yourself on managing risk well – but only for a moment. Why? Because every enterprise is critically dependent on a wide array of vendors and partners that span a broad spectrum of industries. Their risk is your risk. The work of your third-party risk team is critically important in holding your vendors accountable to managing your risk interests well.
  2. Managing risk—whether internal or third-party—requires focus. There are simply too many things to do, giving rise to the endless “hamster wheel of risk management.” A better approach starts with obtaining an accurate picture of your risk surface and the critical exposures across it. This includes third-party relationships, and now fourth-party risk, which bank regulators are now requiring. Do you have the resources to sufficiently manage this? Do you know your risk surface?

Click here to access Riskrecon Cyentia’s Study

The State of Connected Planning

We identify four major planning trends revealed in the data.

  • Trend #1: Aggressively growing companies plan more, plan better, and prioritize planning throughout the organization.

  • Trend #2: Successful companies use enterprise-scale planning solutions.

  • Trend #3: The right decisions combine people, processes, and technology.

  • Trend #4: Advanced analytics yield the insights for competitive advantage.

TREND 01 : Aggressively growing companies prioritize planning throughout the organization

Why do aggressively growing companies value planning so highly? To sustain an aggressive rate of growth, companies need to do two things:

  • Stay aggressively attuned to changes in the market, so they can accurately anticipate future trend
  • Keep employees across the company aligned on business objectives

This is why aggressively growing companies see planning as critical to realizing business goals.

Putting plans into action

Aggressively growing companies don’t see planning as an abstract idea. They also plan more often and more efficiently than other companies. Compared to their counterparts, aggressively growing companies plan with far greater frequency and are much quicker to incorporate market data into their plans

This emphasis on

  • efficiency,
  • speed,
  • and agility

produces real results. Compared to other companies, aggressively growing companies put more of their plans into action. Nearly half of aggressively growing companies turn more than three-quarters of their plans into reality.

For companies that experience a significant gap between planning and execution, here are three ways to begin to close it:

  1. Increase the frequency of your planning. By planning more often, you give yourself more flexibility, can incorporate market data more quickly, and have more time to change plans. A less frequent planning cadence, in contrast, leaves your organization working to incorporate plans that may lag months behind the market.
  2. Plan across the enterprise. Execution can go awry when plans made in one area of the business don’t take into account activities in another area. This disconnect can produce unreachable goals throughout the business, which can dramatically reduce the percentage of a plan that gets executed. To avoid this, create a culture of planning across the enterprise, ensuring that plans include relevant data from all business units.
  3. Leverage the best technology. As the statistic above shows, the companies who best execute on their plans are those who leverage cloud-based enterprise technology. This ensures that companies can plan with all relevant data and incorporate all necessary stakeholders. By doing this, companies can set their plans up for execution as they are made.

Anaplan1

TREND 02 : Successful companies use enterprise-scale planning solutions

Although the idea that planning assists all aspects of a business may seem like common sense, the survey data suggests that taking this assumption seriously can truly help companies come out ahead.

Executives across industries and geographies all agreed that planning benefits every single business outcome, including

  • enhancing revenues,
  • managing costs,
  • optimizing resources,
  • aligning priorities across the organization,
  • making strategies actionable,
  • anticipating market opportunities,
  • and responding to market changes.

In fact, 92 percent of businesses believe that better planning technology would provide better business outcomes for their company. Yet planning by itself is not always a panacea.

Planning does not always equal GOOD planning. What prepares a company for the future isn’t the simple act of planning. It’s the less-simple act of planning well. In business planning, band-aids aren’t solutions

What counts as good planning? As businesses know, planning is a complicated exercise,
involving multiple processes, many different people, and data from across the organization. Doing planning right, therefore, requires adopting a wide-angle view. It requires planners to be able to see past their individual functions and understand how changes in one part of the organization affect the organization as a whole.

The survey results suggest that the best way to give planners this enterprise-level perspective is to use the right technology. Companies whose technology can incorporate data from the entire enterprise are more successful. Companies whose planning technology cannot link multiple areas of the organization, or remove multiple obstacles to planning, in contrast, plan less successfully.

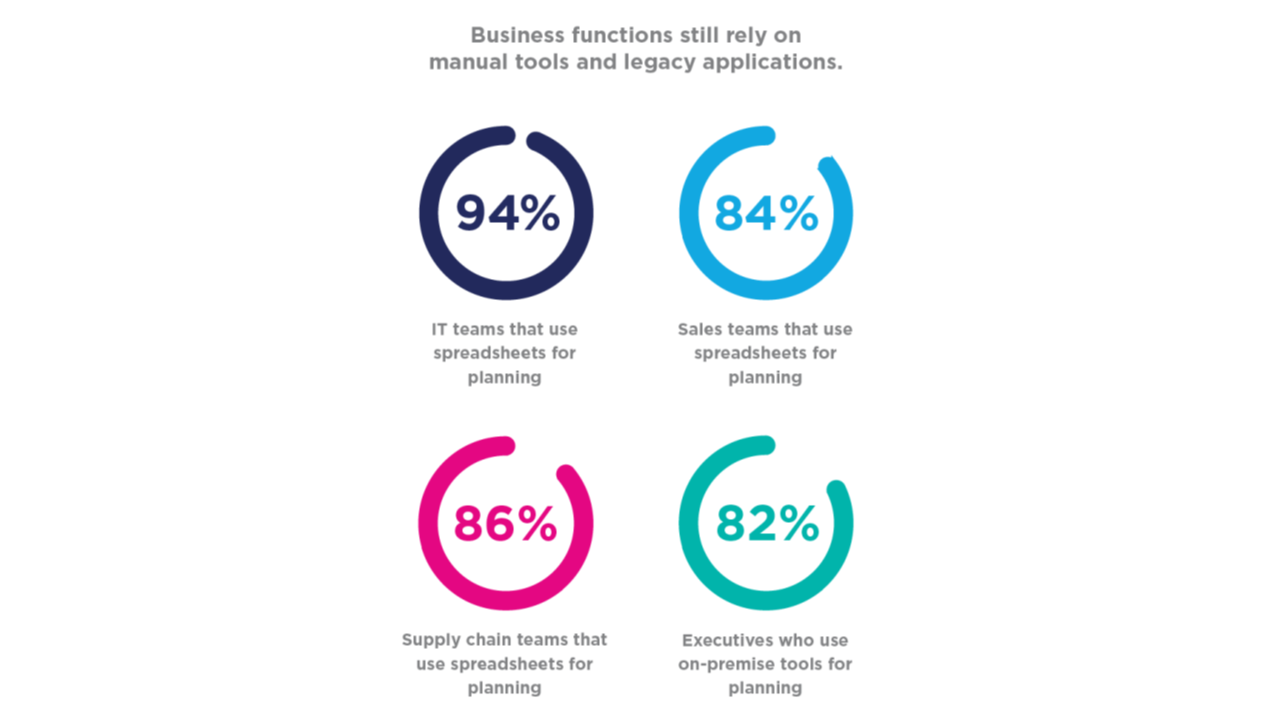
Here are three areas of consideration that can help you begin your Connected Planning journey.

  1. Get the right tools. Uncertainty and volatility continue to grow, and spreadsheets and point solutions lack the agility to pivot or accommodate the volumes of data needed to spot risks and opportunities. Consider tools such as cloud-based, collaborative Connected Planning platforms that use in-memory technology and execute real-time modeling with large volumes of data. Not only can teams work together but plans become more easily embraced and achievable.
  2. Operate from a single platform with reliable data. Traditionally, companies have used individual applications to plan for each business function. These solutions are usually disconnected from one another, which makes data unreliable and cross-functional collaboration nearly impossible. A shared platform that brings together plans with access to shared data reduces or altogether eliminates process inefficiencies and common errors that can lead to bad decision-making.
  3. Transform planning into a continuous, connected process. Sales, supply chain, marketing, and finance fulfill different purposes within the business, but they are inextricably linked and rely on each other for success. The ability to connect different business units through shared technology, data, and processes is at the core of a continuous and connected business planning process.

Anaplan2

TREND 03 The right decisions combine people, processes, and technology

As businesses examine different ways to drive faster, more effective decision-making, planning plays a critical role in meeting this goal. Ninety-nine percent of businesses say that planning is important to managing costs. According to 97 percent of all survey respondents,

  • enhancing revenues,
  • optimizing resource allocation,
  • and converting strategies into actions

are all business objectives for which planning is extremely crucial. Eighty-two percent of executives consider planning to be “critically important” for enhancing revenues.

For planning to be successful across an organization, it need to extend beyond one or two siloed business units. The survey makes this clear: 96 percent of businesses state that
planning is important for aligning priorities across the organization. Yet even though companies recognize planning as a critical business activity, major inefficiencies exist: 97 percent of respondents say that their planning can be improved.

The more planners, the merrier the planning

When describing what they could improve in their planning, four components were all named essential by a majority of respondents.

  • Having the right processes
  • Involving the right people
  • Having the right data
  • Having the right technology

To support strong and effective change management initiatives, successful businesses can build a Center of Excellence (COE). A COE is an internal knowledge-sharing community that brings domain expertise in creating, maturing, and sustaining high-performing business disciplines. It is comprised of an in-house team of subject matter experts who train and share best practices throughout the organization.

By designing a Center of Excellence framework, businesses can get more control over their planning processes with quality, speed, and value, especially as they continue to expand Connected Planning technology into more complex use cases across the company.

Here are six primary benefits that a COE can provide:

  1. Maintaining quality and control of the planning platform as use case expands.
  2. Establishing consistency to ensure reliability within best practices and business data.
  3. Fostering a knowledge-sharing environment to cultivate and develop internal expertise.
  4. Enabling up- and downstream visibility within a single, shared tool.
  5. Driving efficiency in developing, releasing, and maintaining planning models.
  6. Upholding centralized governance and communicating progress, updates, and value to executive sponsors.

Anaplan3

TREND 04 Advanced analytics yield the insights for competitive advantage

Disruption is no longer disruptive for businesses—it’s an expectation. Wide-spread globalization, fluid economies, emerging technologies, and fluctuating consumer demands make unexpected events and evolving business models the normal course of business today.

This emphasizes the critical need for a more proactive, agile, and responsive state of planning. As the data shows, companies that have implemented a more nimble approach to planning are more successful.

Planners don’t have to look far to find better insights. Companies who plan monthly or more are more likely to quickly incorporate new market data into their plans—updating forecasts and plans, assessing the impacts of changes, and keeping an altogether closer eye on ongoing business performance and targets.

However, not all companies are able to plan so continuously: Almost half of respondents indicate that it takes them weeks or longer to update plans with market changes. For businesses that operate in rapidly changing and competitive markets, this lag in planning can be a significant disadvantage.

Advancements in technology can alleviate this challenge. Ninety-two percent of businesses state that improved planning technology would provide better business outcomes for their company. The C-Suite, in particular, is even more optimistic about the adoption of improved technology: More than half of executives say that adopting better planning technology would result in “dramatically better” business performance.

Planning goes digital

Rather than planners hunting for data that simply validates a gut-feeling approach to planning, the survey results indicate that data now sits behind the wheel—informing, developing, improving, and measuring plans.

Organizations, as well as a majority of executives, describe digital transformation as a top priority. Over half of all organizations and 61 percent of executives say that digital transformation amplifies the importance of planning. As businesses move into the future, the increasing use of advanced analytics, which includes predictive analytics and spans to machine learning and artificial intelligence, will determine which businesses come out ahead.

Roadblocks to data-driven planning

Increasing uncertainty and market volatility make it imperative that businesses operate with agile planning that can be adjusted quickly and effectively. However, as planning response times inch closer to real time, nearly a third of organizations continue to cite two main roadblocks to implementing a more data-driven approach:

  • inaccurate planning data and
  • insufficient technology

Inaccurate data plagues businesses in all industries. Sixty-three percent of organizations that use departmental or point solutions, for example, and 59 percent of businesses that use on-premises solutions identify “having the right data” as a key area for improvement in planning. The use of point solutions, in particular, can keep data siloed. When data is stored in disparate technology across the organization, planners end up spending more time consolidating systems and information, which can compromise data integrity.

It’s perhaps these reasons that lead 46 percent of the organizations using point and on-premises solutions to say that better technologies are necessary to accommodate current market conditions. In addition, 43 percent of executives say that a move to cloud-based technology would benefit existing planning.

In both cases, data-driven planning remains difficult, as businesses not employing cloud-based, enterprise technology struggle with poor data accuracy. By moving to cloud-based technology, businesses can automate and streamline tedious processes, which

  • reduces human error,
  • improves productivity,
  • and provides stakeholders with increased visibility into performance.

State-of-planning research reveals that organizations identify multiple business planning
obstacles as equally problematic, indicating a need for increased analytics in solutions that can eliminate multiple challenges at once. Nearly half of all respondents shared a high desire for a collaborative platform that can be used by all functions and departments.

Highly analytical capabilities in planning solutions further support the evolving needs of
today’s businesses. In sales forecasting, machine learning methodologies can quickly analyze past pipeline data to make accurate forecast recommendations. When working in financial planning, machine learning can help businesses analyze weather, social media, and historical sales data to quickly discern their impact on sales.

Here are some additional benefits that machine learning methodologies in a collaborative planning platform can offer businesses:

  1. Manage change to existing plans and respond to periods of uncertainty with accurate demand forecasting and demand sensing
  2. Develop enlightened operations, real-time forecasting, and smart sourcing and resourcing plans
  3. Operations that maintain higher productivity and more control with lower maintenance costs
  4. Targeted customer experience programs that increase loyalty and improve customer engagement
  5. Products and services that are offered at the right price with effective trade promotions, resulting in higher conversions

Anaplan4

Click here to access Anaplan’s detailed White Paper

EIOPA reviews the use of Big Data Analytics in motor and health insurance

Data processing has historically been at the very core of the business of insurance undertakings, which is rooted strongly in data-led statistical analysis. Data has always been collected and processed to

  • inform underwriting decisions,
  • price policies,
  • settle claims
  • and prevent fraud.

There has long been a pursuit of more granular data-sets and predictive models, such that the relevance of Big Data Analytics (BDA) for the sector is no surprise.

In view of this, and as a follow-up of the Joint Committee of the European Supervisory Authorities (ESAs) cross-sectorial report on the use of Big Data by financial institutions,1 the European Insurance and Occupational Pensions Authority (EIOPA) decided to launch a thematic review on the use of BDA specifically by insurance firms. The aim is to gather further empirical evidence on the benefits and risks arising from BDA. To keep the exercise proportionate, the focus was limited to motor and health insurance lines of business. The thematic review was officially launched during the summer of 2018.

A total of 222 insurance undertakings and intermediaries from 28 jurisdictions have participated in the thematic review. The input collected from insurance undertakings represents approximately 60% of the total gross written premiums (GWP) of the motor and health insurance lines of business in the respective national markets, and it includes input from both incumbents and start-ups. In addition, EIOPA has collected input from its Members and Observers, i.e. national competent authorities (NCAs) from the European Economic Area, and from two consumers associations.

The thematic review has revealed a strong trend towards increasingly data-driven business models throughout the insurance value chain in motor and health insurance:

  • Traditional data sources such as demographic data or exposure data are increasingly combined (not replaced) with new sources like online media data or telematics data, providing greater granularity and frequency of information about consumer’s characteristics, behaviour and lifestyles. This enables the development of increasingly tailored products and services and more accurate risk assessments.

EIOPA BDA 1

  • The use of data outsourced from third-party data vendors and their corresponding algorithms used to calculate credit scores, driving scores, claims scores, etc. is relatively extended and this information can be used in technical models.

EIOPA BDA 2

  • BDA enables the development of new rating factors, leading to smaller risk pools and a larger number of them. Most rating factors have a causal link while others are perceived as being a proxy for other risk factors or wealth / price elasticity of demand.
  • BDA tools such as such as artificial intelligence (AI) or machine learning (ML) are already actively used by 31% of firms, and another 24% are at a proof of concept stage. Models based on these tools are often cor-relational and not causative, and they are primarily used on pricing and underwriting and claims management.

EIOPA BDA 3

  • Cloud computing services, which reportedly represent a key enabler of agility and data analytics, are already used by 33% of insurance firms, with a further 32% saying they will be moving to the cloud over the next 3 years. Data security and consumer protection are key concerns of this outsourcing activity.
  • Up take of usage-based insurance products will gradually continue in the following years, influenced by developments such as increasingly connected cars, health wearable devices or the introduction of 5G mobile technology. Roboadvisors and specially chatbots are also gaining momentum within consumer product and service journeys.

EIOPA BDA 4

EIOPA BDA 5

  • There is no evidence as yet that an increasing granularity of risk assessments is causing exclusion issues for high-risk consumers, although firms expect the impact of BDA to increase in the years to come.

In view of the evidence gathered from the different stake-holders, EIOPA considers that there are many opportunities arising from BDA, both for the insurance industry as well as for consumers. However, and although insurance firms generally already have in place or are developing sound data governance arrangements, there are also risks arising from BDA that need to be further addressed in practice. Some of these risks are not new, but their significance is amplified in the context of BDA. This is particularly the case regarding ethical issues with the fairness of the use of BDA, as well as regarding the

  • accuracy,
  • transparency,
  • auditability,
  • and explainability

of certain BDA tools such as AI and ML.

Going forward, in 2019 EIOPA’s InsurTech Task Force will conduct further work in these two key areas in collaboration with the industry, academia, consumer associations and other relevant stakeholders. The work being developed by the Joint Committee of the ESAs on AI as well as in other international fora will also be taken into account. EIOPA will also explore third-party data vendor issues, including transparency in the use of rating factors in the context of the EU-US insurance dialogue. Furthermore, EIOPA will develop guidelines on the use of cloud computing by insurance firms and will start a new workstream assessing new business models and ecosystems arising from InsurTech. EIOPA will also continue its on-going work in the area of cyber insurance and cyber security risks.

Click here to access EIOPA’s detailed Big Data Report

Outsourcing to the Cloud: EIOPA’s Contribution to the European Commission FinTech Action Plan

In the European financial regulatory landscape, the purchase of cloud computing services falls within the broader scope of outsourcing.

The credit institutions, investment firms, payment institutions and the e-money institutions have multiple level 1 and level 2 regulations that discipline their use of outsourcing (e.g. MIFID II, PSD2, BRRD). There are also level 3 measures: CEBS Guidelines on Outsourcing, representing the current guiding framework for outsourcing activities within the European banking sector.

Additional “Recommendations on cloud outsourcing” were issued on December 20, 2017 by the European Banking Authority (EBA) and entered into force on July 1, 2018. They will be repealed by the new guidelines on Outsourcing Arrangements (level 3) which have absorbed the text of the Recommendations.

For the (re)insurance sector, the current Regulatory framework of Solvency II (level 1 and level 2) discipline outsourcing under Articles 38 and 49 of the Directive and Article 274 of the Delegated Regulations. The EIOPA guidelines 60-64 on System of Governance provide level 3 principle based guidance.

On the basis of a survey conducted by the National Supervisory Authorities (NSAs), cloud computing is not extensively used by (re)insurance undertakings: it is most extensively used by newcomers, within a few market niches and by larger undertakings mostly for non-critical functions.

Moreover, as part of their wider digital transformation strategies many European large (re)insurers are expanding their use of the cloud.

As to applicable regulation, cloud computing is considered as outsourcing and the current level of national guidance on cloud outsourcing for the (re)insurance sector is not homogenous. Nonetheless, most NSAs (banking and (re)insurance supervisors at the same time) declare that they are considering the EBA Recommendations as a reference for the management of cloud outsourcing.

Under the steering of its InsurTech TaskForce, EIOPA will develop its own Guidelines on Cloud Outsourcing. The intention is that the Guidelines on Cloud Outsourcing (the “guidelines”) will be drafted during the first half of 2019, issued then for consultation and finalised by the end of the year.

During the process of drafting the Guidelines, EIOPA will organize a public roundtable on the use of cloud computing by (re)insurance undertakings. During the roundtable, representative from the (re)insurance industry, cloud service providers and the supervisory community will discuss views and approaches to cloud outsourcing in a Solvency II and post-EBA Recommendations environment.

Furthermore, in order to guarantee a cross-industry harmonization within the European
financial sector, EIOPA has agreed with the other two ESAs:

  • to continue keeping the fruitful alignment kept so far; and
  • to start – in the second part of 2019 – a joint market monitoring activity aimed at developing policy views on how cloud outsourcing in the finance sector should be treated in the future.

This should take into account the increasing use of the cloud and the potential for large cloud service providers to be a single point of failure.

Overview of Cloud Computing

Cloud computing allows users to access on-demand, shared configurable computing resources (such as networks, servers, storage, applications and services) hosted by third parties on the internet, instead of building their own IT infrastructure.

According to the US National Institute of Standards and Technology (NIST), cloud computing is: “a model for enabling ubiquitous, convenient, on-demand network access to a shared pool of configurable computing resources (e.g., networks, servers, storage, applications, and services) that can be rapidly provisioned and released with minimal management effort or service provider interaction”.

The ISO standard of 2014 defines cloud computing as a: “paradigm for enabling network access to a scalable and elastic pool of shareable physical or virtual resources with self-service provisioning and administration on-demand”. It is composed of

  • cloud computing roles and activities,
  • cloud capabilities types and cloud service categories,
  • cloud deployment models and
  • cloud computing cross cutting aspects”.

The European Banking Authority (EBA) Recommendations of 2017 – very close to NIST definition – defines the cloud services as: “Services provided using cloud computing, that is, a model for enabling ubiquitous, convenient, on-demand network access to a shared pool of configurable computing resources (e.g. networks, servers, storage, applications and services) that can be rapidly provisioned and released with minimal management effort or service provider interaction.

Shared responsibility framework

The cloud provider and cloud customer share the control of resources in a cloud system. The cloud’s different service models affect their control over the computational resources and, thus, what can be done in a cloud system. Compared to traditional IT systems, where one organization has control over the whole stack of computing resources and the entire life-cycle of the systems, cloud providers and cloud customers collaboratively

  • design,
  • build,
  • deploy, and
  • operate

cloud based systems.

The split of control means that both parties share the responsibilities in providing adequate protections to the cloud-based systems. The picture below shows, as “conceptual model”, the different level of sharing responsibilities between the cloud provider and the cloud customer.

These responsibilities contribute to achieve a compliant and secure computing environment. It has to be noted that, regardless the service provided by the cloud provider:

  • Ensuring that the data and its classification are done correctly and that the solution is compliant with regulatory obligations is the responsibility of the customer (e.g. in case of data theft the cloud customer is responsible towards the damaged parties or the customer is responsible to ensure – e.g. with specific contractual obligations – that the provider observe certain compliance requirements such as give the competent authorities access and audit rights);
  • Physical security is the one responsibility that is wholly owned by cloud service providers when using cloud computing.

The remaining responsibilities and controls are shared between customers and cloud providers according to the outsourcing model. However, the responsibility (in a supervisory sense) remains with the customers. Some responsibilities require the cloud provider and customer to manage and administer the responsibility together including auditing of their domains. For example, identity & access management when using a cloud provider’s active directory services could require that the configuration of services such as multi-factor authentication is up to the customer, but ensuring effective functionality is the responsibility of the cloud provider.

EIOPA Outs

Summary of Key Takeaways and EIOPA’s Answer to the European Commission

The key takeaways of the analysis carried out and described within this document are the following:

  1. cloud computing is mostly used extensively by newcomers, by a niche of the market and by larger undertakings mostly for non-critical function. However, as part of their wider digital transformation strategies many European large (re)insurers are expanding their use of the cloud;
  2. the current Regulatory framework of Solvency II (level 1 and level 2) appears to be sound to discipline the outsourcing to the cloud by the current outsourcing provisions (Articles 38 and 49 of the Directive and Article 274 of the Delegated Regulations);
  3. cloud computing is a fast developing service so in order for its regulation to be efficient it should be principle-based rather than attempting at regulating all (re)insurance-related aspects of it;
  4. cloud computing services used by (re)insurance undertakings are aligned to the one used by banking sector. The risks arising from the usage of cloud computing by (re)insurance undertakings appear to be, generally, aligned to the risks bear by the banking players with few minor (re) insurance specificities;
  5. both banking and (re)insurance regulations discipline cloud computing by their current outsourcing provisions. Under these, banking and (re)insurance institutions are required to classify whether the cloud services they receive are „critical or important“. The most common approach is to classify cloud computing on a case-by-case approach – similarly to the other services – on the basis of the service / process / activity / data outsourced;
  6. the impact of cloud computing on the (re)insurance market is assessed differently among jurisdictions: due to the complexity and the high level of technicality of the subject, some jurisdictions have planned to issue (or already issued) national guidance directly applicable to the (re)insurance market on cloud outsourcing;
  7. from the gap analysis carried out, the EBA Recommendations are more specific on the subject (e.g. the specific requirements to build a register of all the cloud service providers) and, being built on shared common principles, can be applied to the wide Solvency II regulations on outsourcing, reflecting their status at level 3;
  8. to provide legal transparency to the market participants (i.e. regulated undertakings and service providers) and to avoid potential regulatory arbitrage, EIOPA should issue guidance on cloud outsourcing aligned with the EBA Recommendations and, where applicable, the EBA Guidelines on outsourcing arrangements with minor amendments.

Click here to access EIOPA’s detailed Contribution Paper

The Innovation Game – How Data is Driving Digital Transformation

Technology waits for no one. And those who strike first will have an advantage. The steady decline in business profitability across multiple industries threatens to erode future investment, innovation and shareholder value. Fortunately, the emergence of artificial intelligence (AI) can help kick-start profitability. Accenture research shows that AI has the potential to boost rates of profitability by an average of 38 percent by 2035 and lead to an economic boost of US$14 trillion across 16 industries in 12 economies by 2035.

Driven by these economic forces, the age of digital transformation is in full swing. Today we can’t be “digital to the core” if we don’t leverage all new data sources – unstructured, dark data and thirty party sources. Similarly, we have to take advantage of the convergence of AI and analytics to uncover previously hidden insights. But, with the increasing use of AI, we also have to be responsible and take into account the social implications.

Finding answers to the biggest questions starts with data, and ensuring you are capitalizing on the vast data sources available within your own business. Thanks to the power of AI/machine learning and advanced algorithms, we have moved from the era of big data to the era of ALL data, and that is helping clients create a more holistic view of their customer and more operational efficiencies.

Embracing the convergence of AI and analytics is crucial to success in our digital transformation. Together,

  • AI-powered analytics unlock tremendous value from data that was previously hidden or unreachable,
  • changing the way we interact with people and technology,
  • improving the way we make decisions, and giving way to new agility and opportunities.

While businesses are still in the infancy of tapping into the vast potential of these combined technologies, now is the time to accelerate. But to thrive, we need to be pragmatic in finding the right skills and partners to guide our strategy.

Finally, whenever we envision the possibilities of AI, we should consider the responsibility that comes with it. Trust in the digital era or “responsible AI” cannot be overlooked. Explainable AI and AI transparency are critical, particularly in such areas as

  • financial services,
  • healthcare,
  • and life sciences.

The new imperative of our digital transformation is to balance intelligent technology and human ingenuity to innovate every facet of business and become a smarter enterprise.

The exponential growth of data underlying the strategic imperative of enterprise digital transformation has created new business opportunities along with tremendous challenges. Today, we see organizations of all shapes and sizes embarking on digital transformation. As uncovered in Corinium Digital’s research, the primary drivers of digital transformation are those businesses focused on addressing increasing customer expectations and implementing efficient internal processes.

Data is at the heart of this transformation and provides the fuel to generate meaningful insights. We have reached the tipping point where all businesses recognize they cannot compete in a digital age using analog-era legacy solutions and architectures. The winners in the next phase of business will be those enterprises that obtain a clear handle on the foundations of modern data management, specifically the nexus of

  • data quality,
  • cloud,
  • and artificial intelligence (AI).

While most enterprises have invested in on-premises data warehouses as the backbone of their analytic data management practices, many are shifting their new workloads to the cloud. The proliferation of new data types and sources is accelerating the development of data lakes with aspirations of gaining integrated analytics that can accelerate new business opportunities. We found in the research that over 60% of global enterprises are now investing in a hybrid, multi-cloud strategy with both data from cloud environments such as Microsoft Azure along with existing on-premises infrastructures. Hence, this hybrid, multicloud strategy will need to correlate with their investments in data analytics, and it will become imperative to manage data seamlessly across all platforms. At Paxata, our mission is to give everyone the power to intelligently profile and transform data into consumable information at the speed of thought. To empower everyone, not just technical users, to prepare their data and make it ready for analytics and decision making.

The first step in making this transition is to eliminate the bottlenecks of traditional IT-led data management practices through AI-powered automation.

Second, you need to apply modern data preparation and data quality principles and technology platforms to support both analytical and operational use cases.

Thirdly, you need a technology infrastructure that embraces the hybrid, multi-cloud world. Paxata sits right at the center stage of this new shift, helping enterprises profile and transform complex data types in highvariety, high-volume environments. As such, we’re excited about partnering with Accenture and Microsoft to accelerate businesses with our ability to deliver modern analytical and operational platforms to address today’s digital transformation requirements.

Artificial intelligence is causing two major revolutions simultaneously among developers and enterprises. These revolutions will drive the technology decisions for the next decade. Developers are massively embracing AI. As a platform company, Microsoft is focused on enabling developers to make the shift to the next app development pattern, driven by the intelligent cloud and intelligent edge.

AI is the runtime that will power the apps of the future. At the same time, enterprises are eager to adopt and integrate AI. Cloud and AI are the most requested topics in Microsoft Executive Briefing Centers. AI is changing how companies serve their customers, run their operations, and innovate.

Ultimately, every business process in every industry will be redefined in profound ways. If it used to be true that “software was eating the world,” it is now true to say that “AI is eating software”. A new competitive differentiator is emerging: how well an enterprise exploits AI to reinvent and accelerate its processes, value chain and business models. Enterprises need a strategic partner who can help them transform their organization with AI. Microsoft is emerging as a solid AI leader as it is in a unique position to address both revolutions. Our strength and differentiation lie in the combination of multiple assets:

  • Azure AI services that bring AI to every developer. Over one million developers are accessing our pre-built and customizable AI services. We have the most comprehensive solution for building bots, combined with a powerful platform for Custom AI development with Azure Machine Learning that spans the entire AI development lifecycle, and a market leading portfolio of pre-built cognitive services that can be readily attached to applications.
  • A unique cloud infrastructure including CPU, GPU, and soon FPGA, makes Azure the most reliable, scalable and fastest cloud to run AI workloads.
  • Unparalleled tools. Visual Studio, used by over 6 million developers, is the most preferred tool in the world for application development. Visual Studio and Visual Studio Code are powerful “front doors” through which to attract developers seeking to add AI to their applications.
  • Ability to add AI to the edge. We enable developers, through our tools and services, to develop an AI model and deploy that model anywhere. Through our support for ONNX – the open source representation for AI models in partnership with Facebook, Amazon, IBM and others – as well as for generic containers, we allow developers to run their models on the IoT edge and leverage the entire IoT solution from Azure.

But the competition to win enterprises is not only played in the platform battlefield, enterprises are demanding solutions. Microsoft AI solutions provide turnkey implementations for customers who want to transform their core processes with AI. Our unique combination of IP and consulting services address common scenarios such as business agents, sales intelligence or marketing intelligence. As our solutions are built on top of our compelling AI platform, unlike ourcompetitors, our customers are not locked in to any one consulting provider, they remain in full control of their data and can extend the scenarios or target new scenarios themselves or through our rich partner ecosystem.

AI Analytics

Click here to access Corinium’s White Paper

Technology Driven Value Generation in Insurance

The evolution of financial technology (FinTech) is reshaping the broader financial services industry. Technology is now disrupting the traditionally more conservative insurance industry, as the rise of InsurTech revolutionises how we think about insurance distribution.

Moreover, insurance companies are improving their operating models, upgrading their propositions, and developing innovative new products to reshape the insurance industry as a whole.

Five key technologies are driving the change today:

  1. Cloud computing
  2. The Internet of Things (including telematics)
  3. Big data
  4. Artificial intelligence
  5. Blockchain

This report examines these technologies’ potential to create value in the insurance industry. It also examines how technology providers could create new income streams and take advantage of economies of scale by offering their technological backbones to participants in the insurance industry and beyond.

Cloud computing refers to storing, managing, and processing data via a network of remote servers, instead of locally on a server or personal computer. Key enablers of cloud computing include the availability of high-capacity networks and service-oriented architecture. The three core characteristics of a cloud service are:

  • Virtualisation: The service is based on hardware that has been virtualised
  • Scalability: The service can scale on demand, with additional capacity brought online within minutes
  • Demand-driven: The client pays for the services as and when they are needed

cloud

Telematics is the most common form of the broader Internet of Things (IoT). The IoT refers to the combination of physical devices, vehicles, buildings and other items embedded with electronics, software, sensors, actuators, and network connectivity that enable these physical objects to collect and exchange data.

The IoT has evolved from the convergence of

  • wireless technologies,
  • micro-electromechanical systems,
  • and the Internet.

This convergence has helped remove the walls between operational technology and information technology, allowing unstructured, machine-generated data to be analysed for insights that will drive improvements.

IoT

Big data refers to data sets that are so large or complex that traditional data processing application software is insufficient to deal with them. A definition refers to the “five V” key challenges for big data in insurance:

  • Volume: As sensors cost less, the amount of information gathered will soon be measured
    in exabytes
  • Velocity: The speed at which data is collected, analysed, and presented to users
  • Variety: Data can take many forms, such as structured, unstructured, text or multimedia. It can come from internal and external systems and sources, including a variety
    of devices
  • Value: Information provided by data about aspects of the insurance business, such as customers and risks
  • Veracity: Insurance companies ensure the accuracy of their plethora of data

Modern analytical methods are required to process these sets of information. The term “big data has evolved to describe the quantity of information analysed to create better outcomes, business improvements, and opportunities that leverage all available data. As a result, big data is not limited to the challenges thrown up by the five Vs. Today there are two key aspects to big data:

  1. Data: This is more-widely available than ever because of the use of apps, social media, and the Internet of Things
  2. Analytics: Advanced analytic tools mean there are fewer restrictions to working with big data

BigData

The understanding of Artificial Intelligence AI has evolved over time. In the beginning, AI was perceived as machines mimicking the cognitive functions that humans associate with other human minds, such as learning and problem solving. Today, we rather refer to the ability of machines to mimic human activity in a broad range of circumstances. In a nutshell, artificial intelligence is the broader concept of machines being able to carry out tasks in a way that we would consider smart or human.

Therefore, AI combines the reasoning already provided by big data capabilities such as machine learning with two additional capabilities:

  1. Imitation of human cognitive functions beyond simple reasoning, such as natural language processing and emotion sensing
  2. Orchestration of these cognitive components with data and reasoning

A third layer is pre-packaging generic orchestration capabilities for specific applications. The most prominent such application today are bots. At a minimum, bots orchestrate natural language processing, linguistic technology, and machine learning to create systems which mimic interactions with human beings in certain domains. This is done in such a way that the customer does not realise that the counterpart is not human.

Blockchain is a distributed ledger technology used to store static records and dynamic transaction data distributed across a network of synchronised, replicated databases. It establishes trust between parties without the use of a central intermediary, removing frictional costs and inefficiency.

From a technical perspective, blockchain is a distributed database that maintains a continuously growing list of ordered records called blocks. Each block contains a timestamp and a link to a previous block. Blockchains have been designed to make it inherently difficult to modify their data: Once recorded, the data in a block cannot be altered retroactively. In addition to recording transactions, blockchains can also contain a coded set of instructions that will self-execute under a pre-specified set of conditions. These automated workflows, known as smart contracts, create trust between a set of parties, as they rely on pre-agreed data sources and and require not third-party to execute them.

Blockchain technology in its purest form has four key characteristics:

  1. Decentralisation: No single individual participant can control the ledger. The ledger
    lives on all computers in the network
  2. Transparency: Information can be viewed by all participants on the network, not just
    those involved in the transaction
  3. Immutability: Modifying a past record would require simultaneously modifying every
    other block in the chain, making the ledger virtually incorruptible
  4. Singularity: The blockchain provides a single version of a state of affairs, which is
    updated simultaneously across the network

Blockchain

Oliver Wyman, ZhongAn Insurance and ZhongAn Technology – a wholly owned subsidiary of ZhongAn insurance and China’s first online-only insurer – are jointly publishing this report to analyse the insurance technology market and answer the following questions:

  • Which technologies are shaping the future of the insurance industry? (Chapter 2)
  • What are the applications of these technologies in the insurance industry? (Chapter 3)
  • What is the potential value these applications could generate? (Chapter 3)
  • How can an insurer with strong technology capabilities monetise its technologies?
    (Chapter 4)
  • Who is benefiting from the value generated by these applications? (Chapter 5)


Click here to access Oliver Wyman’s detailed report