Your Customer Data…Consolidated or Chaotic?
In an ideal world, you know your customers. You know
- who they are,
- what business they transact,
- who they transact with,
- and their relationships.
You use that information to
- calculate risk,
- prevent fraud,
- uncover new business opportunities,
- and comply with regulatory requirements.
The problem at most financial institutions is that customer data environments are highly chaotic. Customer data is stored in numerous systems across the company. Most, if not all of which, has evolved over time in siloed environments according to business function. Each system has its
- own management team,
- technology platform,
- data models,
- quality issues,
- and access policies.

This chaos prevents the firms from fully achieving and maintaining a consolidated view of customers and their activity.
The Cost of Chaos
A chaotic customer data environment can be an expensive problem in a financial institution. Customer changes have to be implemented in multiple systems, with a high likelihood of error or inconsistency because of manual processes. Discrepancies with the data leads to inevitable remediation activities that are widespread, and costly.
Analyzing customer data within one global bank required three months to compile and validate its correctness. The chaos leads to either
- prohibitively high time and cost of data preparation or
- garbage-in, garbage-out analytics.
The result of customer data chaos is an incredibly high risk profile — operational, regulatory, and reputational.
Eliminating the Chaos 1.0
Many financial services companies attempt to eliminate this chaos and consolidate their customer data.
A common approach is to implement a master data management (MDM) system. Customer data from different source systems is centralized into one place where it can be harmonized. The output is a “golden record,” or master customer record.
A lambda architecture permits data to stream into the centralized store and be processed in realtime so that it is immediately mastered and ready for use. Batch processes run on the centralized store to perform periodic (daily, monthly, quarterly, etc.) calculations on the data.
First-generation MDM systems centralize customer data and unify it by writing ETL scripts and matching rules.

The harmonizing often involves:
- Defining a common, master schema in which to store the consolidated data
- Writing ETL scripts to transform the data from source formats and schemas into the new common storage format
- Defining rule sets to deduplicate, match/cluster, and otherwise cleanse within the central MDM store
There are a number of commercial MDM solutions available that support the deterministic approach outlined above. The initial experience with those MDM systems, integrating the first five or so large systems, is often positive. Scaling MDM to master more and more systems, however, becomes a challenge that grows exponentially, as we’ll explain below.
Rules-based MDM, and the Robustness- Versus-Expandability Trade Off
The rule sets used to harmonize data together are usually driven off of a handful of dependent attributes—name, legal identifiers, location, and so on. Let’s say you use six attributes to stitch together four systems, A and B, and then the same six attributes between A and C, then A and D, B and C, B and D, and C and D. Within that example of 4 systems, you would have twenty four potential attributes that you are aligning. Add a fifth system, it’s 60 attributes; a sixth system, 90 attributes. So the effort to master additional systems grows exponentially. And in most multinational financial institutions, the number of synchronized attributes is not six; it’s commonly 50 to 100.
And maintenance is equally burdensome. There’s no guarantee that your six attributes maintain their validity or veracity over time. If any of these attributes need to be modified, then rules need to be redefined across the systems all over again.
The trade off for many financial institutions is robustness versus expandability. In other words, you can have a large-scale data mastering implementation and have it wildly complex, or you can do something small and have it highly accurate.
This is problematic for most financial institutions, which have very large-scale customer data challenges.
Customer Data Mastering at Scale
In larger financial services companies, especially multinationals, the number of systems in which customer data resides is much larger than the examples above. It is not uncommon to see financial companies with over 100 large systems.
Among those are systems that have been:
- Duplicated in many countries to comply with data sovereignty regulations
- Acquired via inorganic growth, purchased companies bringing in their own infrastructure for trading, CRM, HR, and back office. Integrating these can take a significant amount of time and cost

When attempting to master a hundred sources containing petabytes of data, all of which have data linking and matching in different ways across a multitude of attributes and systems, you can see that the matching rules required to harmonize your data together gets incredibly complex.
Every incremental source added to the MDM environment can take thousands of rules to be implemented. Within just a mere handful of systems, the complexity gets to a point where it’s unattainable. As that complexity goes up, the cost of maintaining a rules-based approach also scales wildly, requiring more and more data stewards to make sure all the stitching rules remain correct.
Mastering data at scale is one of the riskiest endeavors a business can take. Gartner reports that 85% of MDM projects fail. And MDM budgets of $10M to $20M per year are not uncommon in large multinationals. With such high stakes, making sure that you get the right approach is critical to making sure that this thing is a success.
A New Take on an Old Paradigm
What follows is a reference architecture. The approach daisy chains together three large tool sets, each with appropriate access policies enforced, that are responsible for three separate steps in the mastering process:
- Raw Data Zone
- Common Data Zone
- Mastered Data Zone
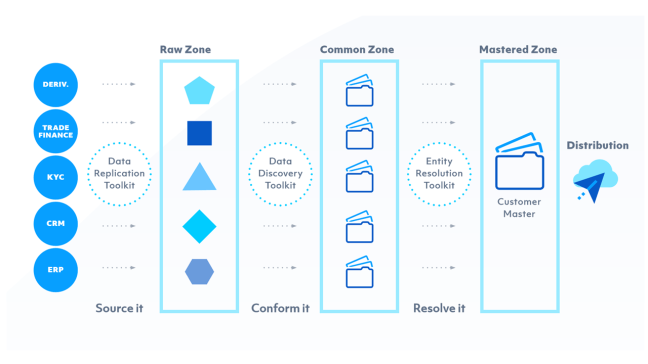
Raw Data Zone The first sits on a traditional data lake model—a landing area for raw data. Data is replicated from source systems to the centralized data repository (often built on Hadoop). Data is replicated in real time (perhaps via Kafka) wherever possible so that data is most up to date. For source systems that do not support real-time replication, nightly batch jobs or flat-file ingestion are used.
Common Data Zone Within the Common Data Zone, we take all of the data from the Raw Zone—with the various different objects, in different shapes and sizes, and conform that into outputs that look and feel the same to the system, with the same column headers, data types, and formats.
The toolset in this zone utilizes machine learning models to categorize data that exists within the Raw Data Zone. Machine learning models are trained on what certain attributes look like—what’s a legal entity, or a registered address, or country of incorporation, or legal hierarchy, or any other field. It does so without requiring anyone having to go back to the source system owners to bog them down with questions about that, saving weeks of effort.
This solution builds up a taxonomy and schema for the conformed data as raw data is processed. Unlike early-generation MDM solutions, this substantially reduces data unification time, often by months per source system, because there is:
- No need to pre-define a schema to hold conformed data
- No need to write ETL to transform the raw data
One multinational bank implementing this reference architecture reported being able to conform the raw data from a 10,000-table system within three days, and without using up source systems experts’ time defining a schema or writing ETL code. In terms of figuring out where relevant data is located in the vast wilderness this solution is very productive and predictable.
Mastered Data Zone In the third zone, the conformed data is mastered, and the outputs of the mastering process are clusters of records that refer to the same real-world entity. Within each cluster, a single, unified golden, master record of the entity is configured. The golden customer record is then distributed to wherever it’s needed:
- Data warehouses
- Regulatory (KYC, AML) compliance systems
- Fraud and corruption monitoring
- And back to operational systems, to keep data changes clean at the source
As with the Common Zone, machine learning models are used. These models eliminate the need to define hundreds of rules to match and deduplicate data. Tamr’s solution applies a probabilistic model that uses statistical analysis and naive Bayesian modeling to learn from existing relationships between various attributes, and then makes record-matching predictions based on these attribute relationships.
Tamr matching models require training, which usually takes just a few days per source system. Tamr presents a data steward with its predictions, and the steward can either confirm or deny them to help Tamr perfect its matching.
With the probabilistic model, Tamr looks at all of the attributes on which it has been trained, and based on the attribute matching, the solution will indicate a confidence level of a match being accurate. Depending on a configurable confidence level threshold, It will disregard entries that fall below the threshold from further analysis and training.
As you train Tamr and correct it, it becomes more accurate over time. The more data you throw at te solution, the better it gets. Which is a stark contrast to the rules-based MDM approach, where the more data you throw at it, it tends to break because the rules can’t keep up with the level of complexity.
Distribution A messaging bus (e.g., Apache Kafka) is often used to distribute mastered customer data throughout the organization. If a source system wants to pick up the master copy from the platform, it subscribes to that topic on the messaging bus to receive the feed of changes.
Another approach is to pipeline deltas from the MDM platform into target system in batch.
Real-world Results
This data mastering architecture is in production at a number of large financial institutions. Compared with traditional MDM approaches, the model-driven approach provides the following advantages:
70% fewer IT resources required:
- Humans in the entity resolution loop are much more productive, focused on a relatively small percentage (~5%) of exceptions that the machine learning algorithms cannot resolve
- Eliminates ETL and matching rules development
- Reduces manual data synchronization and remediation of customer data across systems
Faster customer data unification:
- A global retail bank mastered 35 large IT systems within 6 months—about 4 days per source system
- New data is mastered within 24 hours of landing in the Raw Data Zone
- A platform for mastering any category of data—customer, product, suppler, and others
Faster, more complete achievement of data-driven business initiatives:
- KYC, AML, fraud detection, risk analysis, and others.