A Practical Guide to Analytics and AI in the Cloud With Legacy Data

Introduction

Businesses that use legacy data sources such as mainframe have invested heavily in building a reliable data platform. At the same time, these enterprises want to move data into the cloud for the latest in analytics, data science and machine learning.

The Importance of Legacy Data

Mainframe is still the processing backbone for many organizations, constantly generating important business data.

It’s crucial to consider the following:

MAINFRAME IS THE ENTERPRISE TRANSACTION ENVIRONMENT

In 2019, there was a 55% increase in transaction volume on mainframe environments. Studies estimate that 2.5 billion transactions are run per day, per legacy system across the world.

LEGACY IS THE FUEL BEHIND CUSTOMER EXPERIENCES

Within industries such as financial services and insurance, most customer information lives on legacy systems. Over 70% of enterprises say their customer-facing applications are completely or very reliant on mainframe processing.

BUSINESS-CRITICAL APPLICATIONS RUN ON LEGACY SYSTEMS

Mainframe often holds business-critical information and applications — from credit card transactions to claims processing. For over half of enterprises with a mainframe, they run more than half of their business-critical applications on the platform.

However, they also present a limitation for an organization in its analytics and data science journey. While moving everything to the cloud may not be the answer, identifying ways in which you can start a legacy modernization process is crucial to the next generation of data and AI initiatives.

The Cost of Legacy Data

Across the enterprise, legacy systems such as mainframe serve as a critical piece of infrastructure that is ripe with opportunity for integration with modern analytics platforms. If a modern analytics platform is only as good as the data fed into it, that means enterprises must include all data sources for success. However, many complexities can occur when organizations look to build the data integration pipelines between their modern analytics platform and legacy sources. As a result, the plans made to connect these two areas are often easier said than done.

DATA SILOS HINDER INNOVATION

Over 60% of IT professionals with legacy and modern technology in house are finding that data silos are negatively affecting their business. As data volumes increase, IT can no longer rely on current data integration approaches to solve their silo challenges.

CLOUDY BUSINESS INSIGHTS

Business demands that more decisions are driven by data. Still, few IT professionals who work with legacy systems feel they are successful in delivering data insights that reside outside their immediate department. Data-driven insights will be the key to competitive success. The inability to provide insights puts a business at risk.

SKILLS GAP WIDENS

While it may be difficult to find skills for the latest technology, it’s becoming even harder to find skills for legacy platforms. Enterprises have only replaced 37% of the mainframe workforce lost over the past five years. As a result, the knowledge needed to integrate mainframe data into analytics platforms is disappearing. While the drive for building a modern analytics platform is more powerful than ever, taking this initiative and improving data integration practices that encompass all enterprise data has never been more challenging.

The success of building a modern analytics platform hinges on understanding the common challenges of integrating legacy data sources and choosing the right technologies that can scale with the changing needs of your organization.

Challenges Specific to Extracting Mainframe Data

With so much valuable data on mainframe, the most logical thing to do would be to connect these legacy data sources to a modern data platform. However, many complexities can occur when organizations begin to build integration pipelines to legacy sources. As a result, the plans made to connect these two areas are often easier said than done. Shared challenges of extracting mainframe data for integration with modern analytics platforms include the following:

DATA STRUCTURE

It’s common for legacy data not to be readily compatible with downstream analytics platforms, open-source frameworks and data formats. The varied structures of legacy data sources differ from relational data. Legacy data sources have traits such as

  • hierarchical tables,
  • embedded headers,
  • and trailer and complex data structures (e.g., nested, repeated or redefined elements).

With the incorrect COBOL redefines and logic set up at the start of a data integration workflow, legacy data structures risk slowing down processing speeds to the point of business disruption and can lead to incorrect data for downstream consumption.

METADATA

COBOL copybooks can be a massive hurdle to overcome for integrating mainframe data. COBOL copybooks are the metadata blocks that define the physical layout of data but are stored separately from that data. As a result, they can be quite complicated, containing not just formatting information, but also logic in the form, for example, of nested Occurs Depending On clauses. For many mainframe files, hundreds of copybooks may map to a single file. Feeding mainframe data directly into an analytics platform can result in significant data confusion.

DATA MAPPING

Unlike an RDBMS, which needs data to be entered into a table or column, nothing enforces a set data structure on the mainframe. COBOL copybooks are incredibly flexible so that they

  • can group multiple pieces into one,
  • or subdivide a field into various fields,
  • or ignore whole sections of a record.

As a result, data mapping issues will arise. The copybooks reflect the needs of the program, not the needs of a data-driven view.

DIFFERENT STORAGE FORMATS

Often numeric values stored one way on a mainframe are stored differently when the data is moving to the cloud. Additionally, mainframes use a whole different encoding scheme (EBCDIC vs. ASCII) — it’s an 8-bit structure vs. a 7-bit structure. As a result, multiple numeric encoding schemes allow for the ability to “pack” numbers into less storage (e.g., packed decimal) space. In addition to complex storage formats, there are techniques to use each individual bit to store data.

Whether it’s a lack of internal knowledge on how to handle legacy data or a rigid data framework, ignoring legacy data when building a modern data analytics platform means missing valuable information that can enhance any analytics project.

Pain Points of Building a Modern Analytics Platform

Tackling the challenges of mainframe data integration is no simple task. Besides determining the best approach for integrating these legacy data sources, IT departments are also dealing with the everyday challenges of running a department. Regardless of the size of an organization, there are daily struggles everyone faces, from siloed data to lack of IT skills.

ENVIRONMENT COMPLEXITY

Many organizations have adopted hybrid and multi-cloud strategies to

  • manage data proliferation,
  • gain flexibility,
  • reduce costs
  • and increase capacities.

Cloud storage and the lakehouse architecture offer new ways to manage and store data. However, organizations still need to maintain and integrate their mainframes and other on-premises systems — resulting in a challenging integration strategy that must encompass a variety of environments.

SILOED DATA

The increase in data silos adds further complexity to growing data volumes. Data silo creation happens as a direct result of increasing data sources. Research has shown that data silos have directly inhibited the success of analytics and machine learning projects.

PERFORMANCE

Processing the requirements of growing data volumes can cause a slowdown in a data stream. Loading hundreds, or even thousands, of database tables into a big data platform — combined with an inefficient use of system resources — can create a data bottleneck that hampers the performance of data integration pipelines.

DATA QUALITY

Industry studies have shown that up to 90% of a data scientist’s time is getting data to the right condition for use in analytics. In other words, 90% of the time, data feeding analytics cannot be trusted. Data quality processes that include

  • mapping,
  • matching,
  • linking,
  • merging,
  • deduplication
  • and actionable data

are critical to providing frameworks with trusted data.

DATA TYPES AND FORMATS

Valuable data for analytics comes from a range of sources across the organization from CRM, ERPs, mainframes and online transaction processing systems. However, as organizations rely on more systems, the data types and formats continue to grow.

IT now has the challenge of making big data, NoSQL and unstructured data all readable for downstream analytics solutions.

SKILLS GAP AND RESOURCES

The need for workers who understand how to build data integration frameworks for mainframe, cloud, and cluster data sources is increasing, but the market cannot keep up. Studies have shown that unfilled data engineer jobs and data scientist jobs have increased 12x in the past year alone. As a result, IT needs to figure out how to integrate data for analytics with the skills they have internally.

What Your Cloud Data Platform Needs

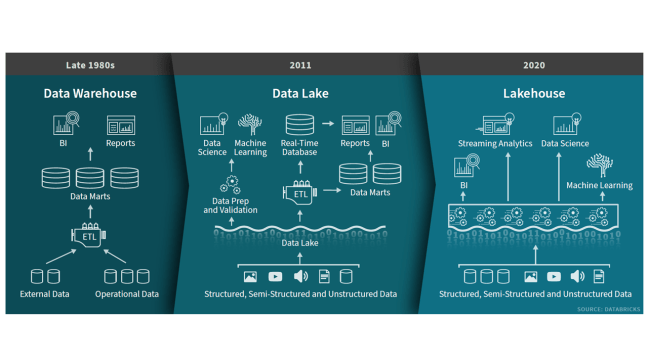
A new data management paradigm has emerged that combines the best elements of data lakes and data warehouses, enabling

  • analytics,
  • data science
  • and machine learning

on all your business data: lakehouse.

Lakehouses are enabled by a new system design: implementing similar data structures and data management features to those in a data warehouse, directly on the kind of low-cost storage used for data lakes. They are what you would get if you had to redesign data warehouses in the modern world, now that cheap and highly reliable storage (in the form of object stores) are available.

This new paradigm is the vision for data management that provides the best architecture for modern analytics and AI. It will help organizations capture data from hundreds of sources, including legacy systems, and make that data available and ready for analytics, data science and machine learning.

Lakehouse

A lakehouse has the following key features:

  • Open storage formats, such as Parquet, avoid lock-in and provide accessibility to the widest variety of analytics tools and applications
  • Decoupled storage and compute provides the ability to scale to many concurrent users by adding compute clusters that all access the same storage cluster
  • Transaction support handles failure scenarios and provides consistency when multiple jobs concurrently read and write data
  • Schema management enforces the expected schema when needed and handles evolving schemas as they change over time
  • Business intelligence tools directly access the lakehouse to query data, enabling access to the latest data without the cost and complexity of replicating data across a data lake and a data warehouse
  • Data science and machine learning tools used for advanced analytics rely on the same data repository
  • First-class support for all data types across structured, semi-structured and unstructured, plus batch and streaming data

Click here to access Databricks’ and Precisely’s White Paper

Benchmarking digital risk factors facing financial service firms

Risk management is the foundation upon which financial institutions are built. Recognizing risk in all its forms—measuring it, managing it, mitigating it—are all critical to success. But has every firm achieved that goal? It doesn’t take indepth research beyond the myriad of breach headlines to answer that question.

But many important questions remain: What are key dimensions of the financial sector Internet risk surface? How does that surface compare to other sectors? Which specific industries within Financial Services appear to be managing that risk better than others? We take up these questions and more in this report.

  1. The financial sector boasts the lowest rate of high and critical security exposures among all sectors. This indicates they’re doing a good job managing risk overall.
  2. But not all types of financial service firms appear to be managing risk equally well. For example, the rate of severe findings in the smallest commercial banks is 4x higher than that of the largest banks.
  3. It’s not just small community banks struggling, however. Securities and Commodities firms show a disconcerting combination of having the largest deployment of high-value assets AND the highest rate of critical security exposures.
  4. Others appear to be exceeding the norm. Take credit card issuers: they typically have the largest Internet footprint but balance that by maintaining the lowest rate of security exposures.
  5. Many other challenges and risk factors exist. For instance, the industry average rate of severe security findings in critical cloud-based assets is 3.5x that of assets hosted on-premises.

Dimensions of the Financial Sector Risk Surface

As Digital Transformation ushers in a plethora of changes, critical areas of risk exposure are also changing and expanding. We view the risk surface as anywhere an organization’s ability to operate, reputation, assets, legal obligations, or regulatory compliance is at risk. The aspects of a firm’s risk exposure that are associated with or observable from the internet are considered its internet risk surface. In Figure 1, we compare five key dimensions of the internet risk surface across different industries and highlight where the financial sector ranks among them.

  • Hosts: Number of internet-facing assets associated with an organization.
  • Providers: Number of external service providers used across hosts.
  • Geography: Measure of the geographic distribution of a firm’s hosts.
  • Asset Value: Rating of the data sensitivity and business criticality of hosts based on multiple observed indicators. High value systems that include those that collect GDPR and CCPA regulated information.
  • Findings: Security-relevant issues that expose hosts to various threats, following the CVSS rating scale.

TR1

The values recorded in Figure 1 for these dimensions represent what’s “typical” (as measured by the mean or median) among organizations within each sector. There’s a huge amount of variation, meaning not all financial institutions operate more external hosts than all realtors, but what you see here is the general pattern. The blue highlights trace the ranking of Finance along each dimension.

Financial firms are undoubtedly aware of these tendencies and the need to protect those valuable assets. What’s more, that awareness appears to translate fairly effectively into action. Finance boasts the lowest rate of high and critical security exposures among all sectors. We also ran the numbers specific to high-value assets, and financial institutions show the lowest exposure rates there too. All of this aligns pretty well with expectations—financial firms keep a tight rein on their valuable Internet-exposed assets.

This control tendency becomes even more apparent when examining the distribution of hosts with severe findings in Figure 2. Blue dots mark the average exposure rate for the entire sector (and correspond to values in Figure 1), while the grey bars indicate the amount of variation among individual organizations within each sector. The fact that Finance exhibits the least variation shows that even rotten apples don’t fall as far from the Finance tree as they often do in other sectors. Perhaps a rising tide lifts all boats?

TR2

Security Exposures in Financial Cloud Deployments

We now know financial institutions do well minimizing security findings, but does that record stand equally strong across all infrastructure? Figure 3 answers that question by featuring four of the five key risk surface dimensions:

  • the proportion of hosts (square size),
  • asset value (columns),
  • hosting location (rows),
  • and the rate of severe security findings (color scale and value label).

This view facilitates a range of comparisons, including the relative proportion of assets hosted internally vs. in the cloud, how asset value distributes across hosting locales, and where high-severity issues accumulate.

TR3

From Figure 3, box sizes indicate that organizations in the financial sector host a majority of their Internet-facing systems on-premises, but do leverage the cloud to a greater degree for low-value assets. The bright red box makes it apparent that security exposures concentrate more acutely in high-value assets hosted in the cloud. Overall, the rate of severe findings in cloud-based assets is 3.5x that of on-prem. This suggests the angst many financial firms have over moving to the cloud does indeed have some merit. But when we examine the Finance sector relative to others in Figure 4 the intensity of exposures in critical cloud assets appears much less drastic.

In Figure 3, we can see that the largest number of hosts are on-prem and of medium value. But high-value assets in the cloud exhibit the highest rate of findings.

Given that cloud vs. on-prem exposure disparity, we feel the need to caution against jumping to conclusions. We could interpret these results to proclaim that the cloud isn’t ready for financial applications and should be avoided. Another interpretation could suggest that it’s more about organizational readiness for the cloud than the inherent insecurity of the cloud. Either way, it appears that many financial institutions migrating to the cloud are handling that paradigm shift better than others.

It must also be noted that not all cloud environments are the same. Our Cloud Risk Surface report discovered an average 12X difference between cloud providers with the highest and lowest exposure rates. We still believe this says more about the typical users and use cases of the various cloud platforms than any intrinsic security inequalities. But at the same time, we recommend evaluating cloud providers based on internal features as well as tools and guidance they make available to assist customers in securing their environments. Certain clouds are undoubtedly a better match for financial services use cases while others less so.

TR4

Risk Surface of Subsectors within Financial Services

Having compared Finance to other sectors at a high level, we now examine the risk surface of major subsectors of financial services according to the following NAICS designations:

  • Insurance Carriers: Institutions engaged in underwriting and selling annuities, insurance policies, and benefits.
  • Credit Intermediation: Includes banks, savings institutions, credit card issuers, loan brokers, and processors, etc.
  • Securities & Commodities: Investment banks, brokerages, securities exchanges, portfolio management, etc.
  • Central Banks: Monetary authorities that issue currency, manage national money supply and reserves, etc.
  • Funds & Trusts: Funds and programs that pool securities or other assets on behalf of shareholders or beneficiaries.

TR5

Figure 5 compares these Finance subsectors along the same dimensions used in Figure 1. At the top, we see that Insurance Carriers generally maintain a large Internet surface area (hosts, providers, countries), but a comparatively lower ranking for asset value and security findings. The Credit Intermediation subsector (the NAICS designation that includes banks, brokers, creditors, and processors) follows a similar pattern. This indicates that such organizations are, by and large, able to maintain some level of control over their expanding risk surface.

A leading percentage of high-value assets and a leading percentage of highly critical security findings for the Securities and Commodities subsector is a disconcerting combination. It suggests either unusually high risk tolerance or ineffective risk management (or both), leaving those valuable assets overexposed. The Funds and Trusts subsector exhibits a more riskaverse approach to minimizing exposures across its relatively small digital footprint of valuable assets.

Risk Surface across Banking Institutions

Given that the financial sector is so broad, we thought a closer examination of the risk surface particular to banking institutions was in order. Banks have long concerned themselves with risk. Well before the rise of the Internet or mobile technologies, banks made their profits by determining how to gauge the risk of potential borrowers or loans, plotting the risk and reward of offering various deposit and investment products, or entering different markets, allowing access through several delivery channels. It could be said that the successful management and measurement of risk throughout an organization is perhaps the key factor that has always determined the relative success or failure of any bank.

As a highly-regulated industry in most countries, banking institutions must also consider risk from more than a business or operational perspective. They must take into account the compliance requirements to limit risk in various areas, and ensure that they are properly securing their systems and services in a way that meets regulatory standards. Such pressures undoubtedly affect the risk surface and Figure 6 hints at those effects on different types of banking institutions.

Credit card issuers earn the honored distinction of having the largest average number of Internet-facing hosts (by far) while achieving the lowest prevalence of severe security findings. Credit unions flip this trend with the fewest hosts and most prevalent findings. This likely reflects the perennial struggle of credit unions to get the most bang from their buck.

Traditionally well-resourced commercial banks leverage the most third party providers and have a presence in more countries, all with a better-than-average exposure rate. Our previous research revealed that commercial banks were among the top two generators and receivers of multi-party cyber incidents, possibly due to the size and spread of their risk surface.

TR6

Two Things to Consider

  1. In this interconnected world, third-party and fourth-party risk is your risk. If you are a financial institution, particularly a commercial bank, take a moment to congratulate yourself on managing risk well – but only for a moment. Why? Because every enterprise is critically dependent on a wide array of vendors and partners that span a broad spectrum of industries. Their risk is your risk. The work of your third-party risk team is critically important in holding your vendors accountable to managing your risk interests well.
  2. Managing risk—whether internal or third-party—requires focus. There are simply too many things to do, giving rise to the endless “hamster wheel of risk management.” A better approach starts with obtaining an accurate picture of your risk surface and the critical exposures across it. This includes third-party relationships, and now fourth-party risk, which bank regulators are now requiring. Do you have the resources to sufficiently manage this? Do you know your risk surface?

Click here to access Riskrecon Cyentia’s Study

Perspectives on the next wave of cyber

Financial institutions are acutely aware that cyber risk is one of the most significant perils they face and one of the most challenging to manage. The perceived intensity of the threats, and Board level concern about the effectiveness of defensive measures, ramp up continually as bad actors increase the sophistication, number, and frequency of their attacks.

Cyber risk management is high on or at the top of the agenda for financial institutions across the sector globally. Highly visible attacks of increasing insidiousness and sophistication are headline news on an almost daily basis. The line between criminal and political bad actors is increasingly blurred with each faction learning from the other. In addition, with cyberattack tools and techniques becoming more available via the dark web and other sources, the population of attackers continues to increase, with recent estimates putting the number of cyberattackers globally in the hundreds of thousands.

Cyber offenses against banks, clearers, insurers, and other major financial services sector participants will not abate any time soon. Looking at the velocity and frequency of attacks, the motivation for cyberattack upon financial services institutions can be several hundred times higher than for non-financial services organizations.

Observing these developments, regulators are prescribing increasingly stringent requirements for cyber risk management. New and emerging regulation will force changes on many fronts and will compel firms to demonstrate that they are taking cyber seriously in all that they do. However, compliance with these regulations will only be one step towards assuring effective governance and control of institutions’ Cyber Risk.

We explore the underlying challenges with regard to cyber risk management and analyze the nature of increasingly stringent regulatory demands. Putting these pieces together, we frame five strategic moves which we believe will enable businesses to satisfy business needs, their fiduciary responsibilities with regard to cyber risk, and regulatory requirements:

  1. Seek to quantify cyber risk in terms of capital and earnings at risk.
  2. Anchor all cyber risk governance through risk appetite.
  3. Ensure effectiveness of independent cyber risk oversight using specialized skills.
  4. Comprehensively map and test controls, especially for third-party interactions.
  5. Develop and exercise major incident management playbooks.

These points are consistent with global trends for cyber risk management. Further, we believe that our observations on industry challenges and the steps we recommend to address them are applicable across geographies, especially when considering prioritization of cyber risk investments.

FIVE STRATEGIC MOVES

The current environment poses major challenges for Boards and management. Leadership has to fully understand the cyber risk profile the organization faces to simultaneously protect the institution against everchanging threats and be on the front foot with regard to increasing regulatory pressures, while prioritizing the deployment of scarce resources. This is especially important given that regulation is still maturing and it is not yet clear how high the compliance bars will be set and what resources will need to be committed to achieve passing grades.

With this in mind, we propose five strategic moves which we believe, based on our experience, will help institutions position themselves well to address existing cyber risk management challenges.

1) Seek to quantify cyber risk in terms of capital and earnings at risk

Boards of Directors and all levels of management intuitively relate to risks that are quantified in economic terms. Explaining any type of risk, opportunity, or tradeoff relative to the bottom line brings sharper focus to the debate.

For all financial and many non-financial risks, institutions have developed methods for quantifying expected and unexpected losses in dollar terms that can readily be compared to earnings and capital. Further, regulators have expected this as a component of regulatory and economic capital, CCAR, and/or resolution and recovery planning. Predicting losses due to Cyber is particularly difficult because it consists of a combination of direct, indirect, and reputational elements which are not easy to quantify. In addition, there is limited historical cyber loss exposure data available to support robust cyber risk quantification.

Nevertheless, institutions still need to develop a view of their financial exposures of cyber risk with different levels of confidence and understand how this varies by business line, process, or platform. In some cases, these views may be more expert based, using scenario analysis approaches as opposed to raw statistical modeling outputs. The objectives are still the same – to challenge perspectives as to

  • how much risk exposure exists,
  • how it could manifest within the organization,
  • and how specific response strategies are reducing the institution’s inherent cyber risk.

2) Anchor all cyber risk governance through risk appetite

Regulators are specifically insisting on the establishment of a cyber risk strategy, which is typically shaped by a cyber risk appetite. This should represent an effective governance anchor to help address the Board’s concerns about whether appropriate risks are being considered and managed effectively.

Setting a risk appetite enables the Board and senior management to more deeply understand exposure to specific cyber risks, establish clarity on the Cyber imperatives for the organization, work out tradeoffs, and determine priorities.

Considering cyber risk in this way also enables it to be brought into a common framework with all other risks and provides a starting point to discuss whether the exposure is affordable (given capital and earnings) and strategically acceptable.

Cyber risk appetite should be cascaded down through the organization and provide a coherent management and monitoring framework consisting of

  • metrics,
  • assessments,
  • and practical tests or exercises

at multiple levels of granularity. Such cascading establishes a relatable chain of information at each management level across business lines and functions. Each management layer can hold the next layer more specifically accountable. Parallel business units and operations can have common standards for comparing results and sharing best practices.

Finally, Second and Third Line can have focal points to review and assure compliance. A risk appetite chain further provides a means for the attestation of the effectiveness of controls and adherence to governance directives and standards.

Where it can be demonstrated that risk appetite is being upheld to procedural levels, management will be more confident in providing the attestations that regulators require.

cyber1

3) Ensure effectiveness of independent cyber risk oversight using specialized skills

From our perspective, firms face challenges when attempting to practically fit cyber risk management into a “Three Lines of Defense” model and align cyber risk holistically within an enterprise risk management framework.

CROs and risk management functions have traditionally developed specialized skills for many risk types, but often have not evolved as much depth on IT and cyber risks. Organizations have overcome this challenge by weaving risk management into the IT organization as a First Line function.

In order to more clearly segregate the roles between IT, business, and Information Security (IS), the Chief Information Security Officer (CISO) and the IS team will typically need to be positioned as a « 1.5 Line of Defense » position. This allows an Information Security group to provide more formal oversight and guidance on the cyber requirements and to monitor day-today compliance across business and technology teams.

Further independent risk oversight and audit is clearly needed as part of the Third Line of Defense. Defining what oversight and audit means becomes more traceable and tractable when specific governance mandates and metrics from the Board down are established.

Institutions will also need to deal with the practical challenge of building and maintaining Cyber talent that can understand the business imperatives, compliance requirements, and associated cyber risk exposures.

At the leadership level, some organizations have introduced the concept of a Risk Technology Officer who interfaces with the CISO and is responsible for integration of cyber risk with operational risk.

4) Comprehensively map and test controls, especially for the third party interactions

Institutions need to undertake more rigorous and more frequent assessments of cyber risks across operations, technology, and people. These assessments need to test

  • the efficacy of surveillance,
  • the effectiveness of protection and defensive controls,
  • the responsiveness of the organization,
  • and the ability to recover

in a manner consistent with expectations of the Board.

Given the new and emerging regulatory requirements, firms will need to pay closer attention to the ongoing assessment and management of third parties. Third parties need to be tiered based on their access and interaction with the institution’s high value assets. Through this assessment of process, institutions need to obtain a more practical understanding of their ability to get early warning signals against cyber threats. In a number of cases, a firm may choose to outsource more IT or data services to third party providers (e.g., Cloud) where they consider that this option represents a more attractive and acceptable solution relative to the cost or talent demands associated with maintaining Information Security in-house for certain capabilities. At the same time, the risk of third party compromise needs to be fully understood with respect to the overall risk appetite.

cyber3

5) Develop and exercise incident management playbooks

A critical test of an institution’s cyber risk readiness is its ability to quickly and effectively respond when a cyberattack occurs.

As part of raising the bar on cyber resilience, institutions need to ensure that they have clearly documented and proven cyber incident response plans that include

  • a comprehensive array of attack scenarios,
  • clear identification of accountabilities across the organization,
  • response strategies,
  • and associated internal and external communication scenarios.

Institutions need to thoroughly test their incident response plan on an ongoing basis via table top exercises and practical drills. As part of a table top exercise, key stakeholders walk through specific attack scenarios to test their knowledge of response strategies. This exercise provides an avenue for exposing key stakeholders to more tangible aspects of cyber risk and their respective roles in the event of a cyberattack. It also can reveal gaps in specific response processes, roles, and communications that the institution will need to address.

Last but not least, incident management plans need to be reviewed and refined based on changes in the overall threat landscape and an assessment of the institution’s cyber threat profile; on a yearly or more frequent basis depending on the nature and volatility of the risk for a given business line or platform.

CONCLUSION

Cyber adversaries are increasingly sophisticated, innovative, organized, and relentless in developing new and nefarious ways to attack institutions. Cyber risk represents a relatively new class of risk which brings with it the need to grasp the often complex technological aspects, social engineering factors, and changing nature of Operational Risk as a consequence of cyber.

Leadership has to understand the threat landscape and be fully prepared to address the associated challenges. It would be impractical to have zero tolerance to cyber risk, so institutions will need to determine their risk appetite with regard to cyber, and consequently, make direct governance, investment, and operational design decisions.

The new and emerging regulations are a clear directive to financial institutions to keep cyber risk at the center of their enterprise-wide business strategy, raising the overall bar for cyber resilience. The associated directives and requirements across the many regulatory bodies represent a good and often strong basis for cyber management practices but each institution will need to further ensure that they are tackling cyber risk in a manner fully aligned with the risk management strategy and principles of their firm. In this context, we believe the five moves represent multiple strategically important advances almost all financial services firms will need to make to meet business security, resiliency, and regulatory requirements.

cyber2

click here to access mmc’s cyber handbook