EIOPA proposal for Regulatory Technical Standards (RTS) on management of sustainability risks including sustainability risk plans – Part 2

Our recent article presented EIOPA’s RTS proposal regarding the requirements of sustainability risk management with respect to ORSA, governance and key functions within the future, significantly broadened Solvency II framework.

This article will focus on materiality and financial assessment of sustainability risks as well as on proposed metrics, targets, and actions described by the RTS draft.

Materiality assessment

The definition of materiality under Solvency II and the European Sustainability Reporting Standards (ESRS) are aligned in their focus on the potential impact of information on decision-making.

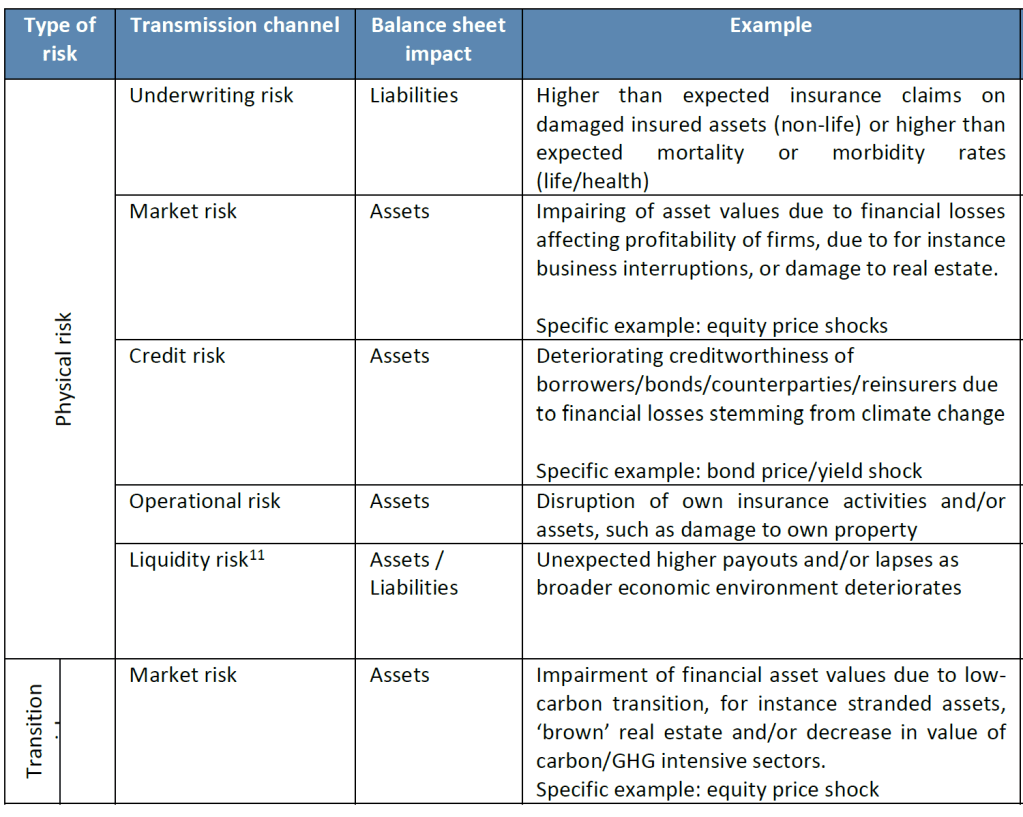
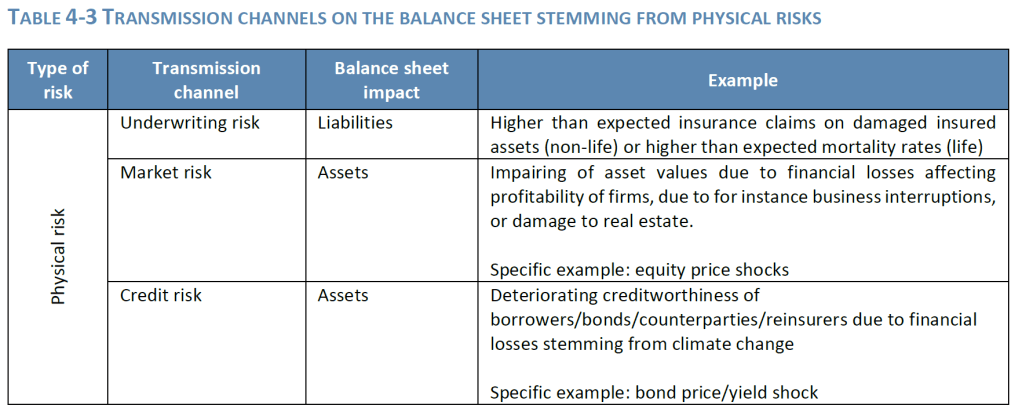
  • Under Solvency II, for public disclosure purposes, materiality means that if an issue is omitted or misstated, it could influence the decision-making or judgment of users of the information, including supervisory authorities. As to financial materiality, sustainability risks can translate in a financial impact on the (re)insurer’s assets and liabilities through existing risk categories, such as underwriting, market, counterparty default or operational risk as well as reputational risk or strategic risk. In other words, they are ‘drivers’ to existing risk categories.
  • Similarly, the ESRS defines materiality as the potential for sustainability-related information to influence decisions that users make on the basis of the undertaking’s reporting. In the context of financial materiality, which is relevant for Solvency II purposes, the ESRS specifies that a sustainability matter is considered material if it could trigger or reasonably be expected to trigger material financial effects on the undertaking. This includes material influence on the undertaking’s development, financial position, financial performance, cash flows, access to finance or cost of capital over the short-, medium- or long-term. The materiality of risks is based on a combination of the likelihood of occurrence and the potential magnitude of the financial effects.

The two frameworks are aligned as material financial effects, as defined by the ESRS, would likely influence the decision-making or judgment of users of the information, including supervisory authorities. This alignment enables undertakings to apply a consistent materiality assessment approach across both Solvency II and ESRS reporting requirements.

Both Solvency II and ESRS do not set a quantitative threshold for defining materiality. The RTS do not specify a threshold for materiality either, considering this should be entity-specific. The undertakings should however define and document clear and quantifiable materiality thresholds, taking into account the above and provide an explanation on the assumptions made for the categorisation into non-material and on how the conclusion on the materiality has been reached. The classification of an exposure or risk as material has bearing on its prudential treatment, as it is a factor that determines whether the risk should be further subject to scenario analysis in the undertaking’s ORSA. The RTS require the undertaking to explain its materiality threshold in the plan: the assumptions for classifying risks as (non-) material in light of the undertaking’s risk appetite and strategy.

The materiality assessment should consider that:

  • Sustainability risks are potential drivers of prudential risk on both sides of the (re)insurers’ balance sheet.
  • Sustainability risks can lead to potential secondary effects or indirect impacts.
  • The exposure of undertakings to sustainability risks can vary across regions, sectors, and lines of business.
  • Sustainability risks can materialise well beyond the one-year time horizon as well as have sudden and immediate impact. Therefore, the materiality assessment necessitates a forwardlooking perspective, including short, medium, and long term. For example, certain geographical locations may not be subject to flood risk today but may be so in the future due to sea level rise. The risk assessment should be performed gross and net of reinsurance, to measure the risk of reliance on reinsurance.

The materiality assessment would consist of a high-level description of the business context of the undertaking considering sustainability risks (‘narrative’) and the assessment of the exposure of the business strategy and model to sustainability risk (‘exposure assessment’), to decide whether a risk could be potentially material. Following this, based on the identification of a potentially material risk, the undertaking would perform an assessment of the potential financial impact (i.e., financial risk assessment, as part of ORSA).

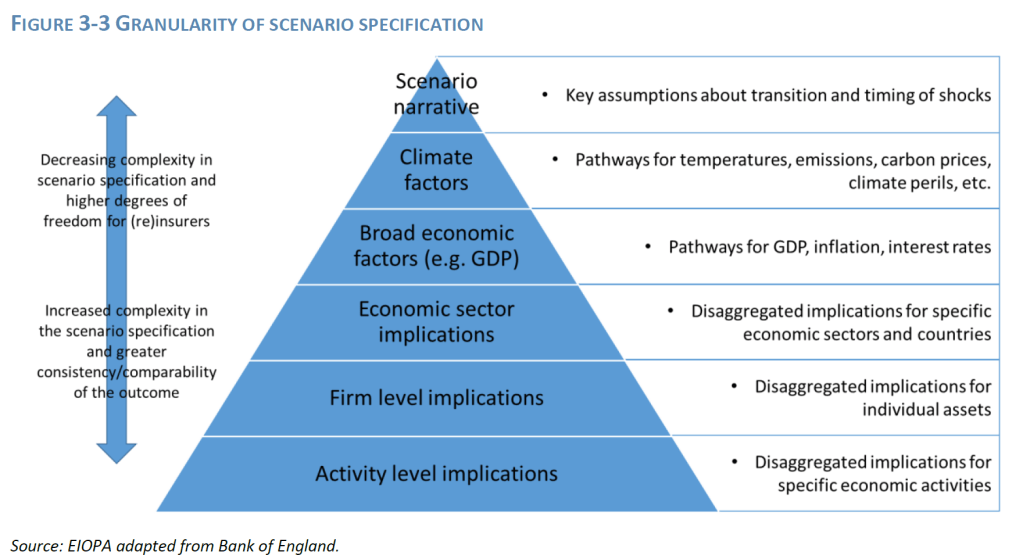
The narrative should describe the business context of the undertaking regarding sustainability risks, and the current strategy of the undertaking. It also describes the long-term outcome, the pathway to that outcome, and the related actions to achieve that outcome (e.g., emissions pathways, technology developments, policy changes and socio-economic impacts).

The narrative would include a view on the broader impact of national or European transition targets on the economy, or the effect of a transition risk throughout the value chain. The narrative should include other relevant sustainability risks than climate, such as risks related to loss of biodiversity, or social and governance risks, as well as interlinkages between sustainability risks (e.g., between climate and biodiversity or climate and social) and spill-over and compounding effects looking beyond specific sustainability risk drivers on particular lines of business.

Sustainability narratives, indicators, and interlinkages

  • Narrative: For example, for climate change undertakings may refer to publicly available climate change pathways (i.e., the Representative Concentration Pathways (RCPs) developed by the Intergovernmental Panel on Climate Change (IPCC); Network for Greening the Financial System (NGFS)) or develop their own climate change pathway.
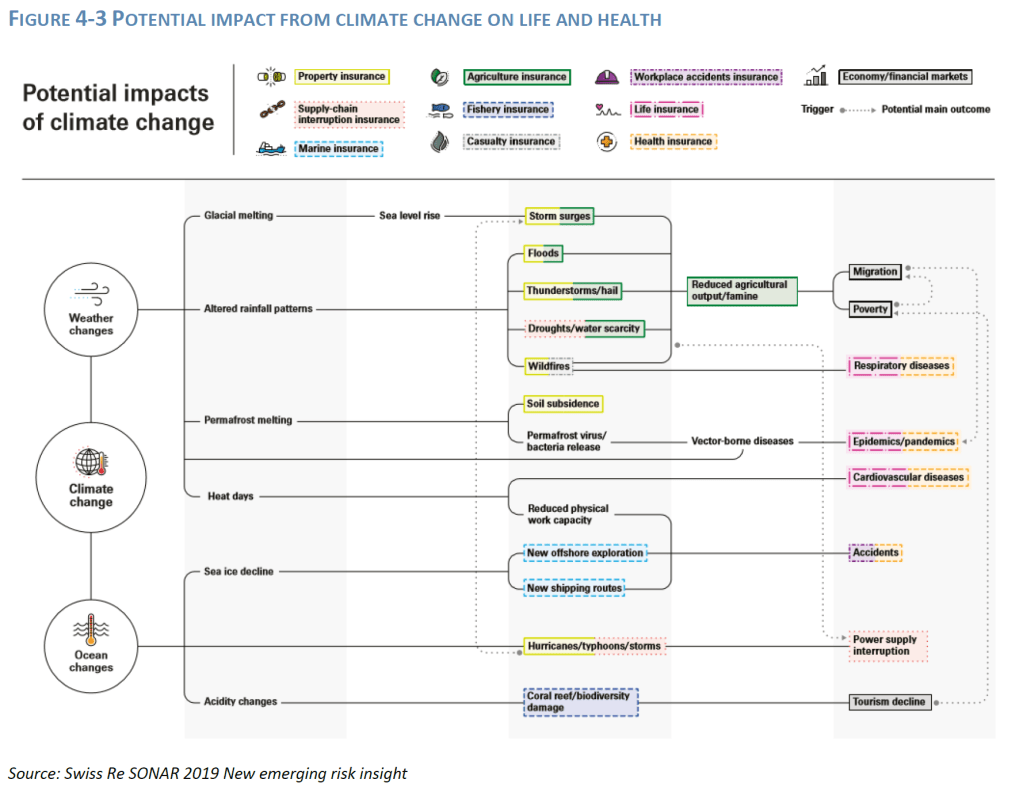
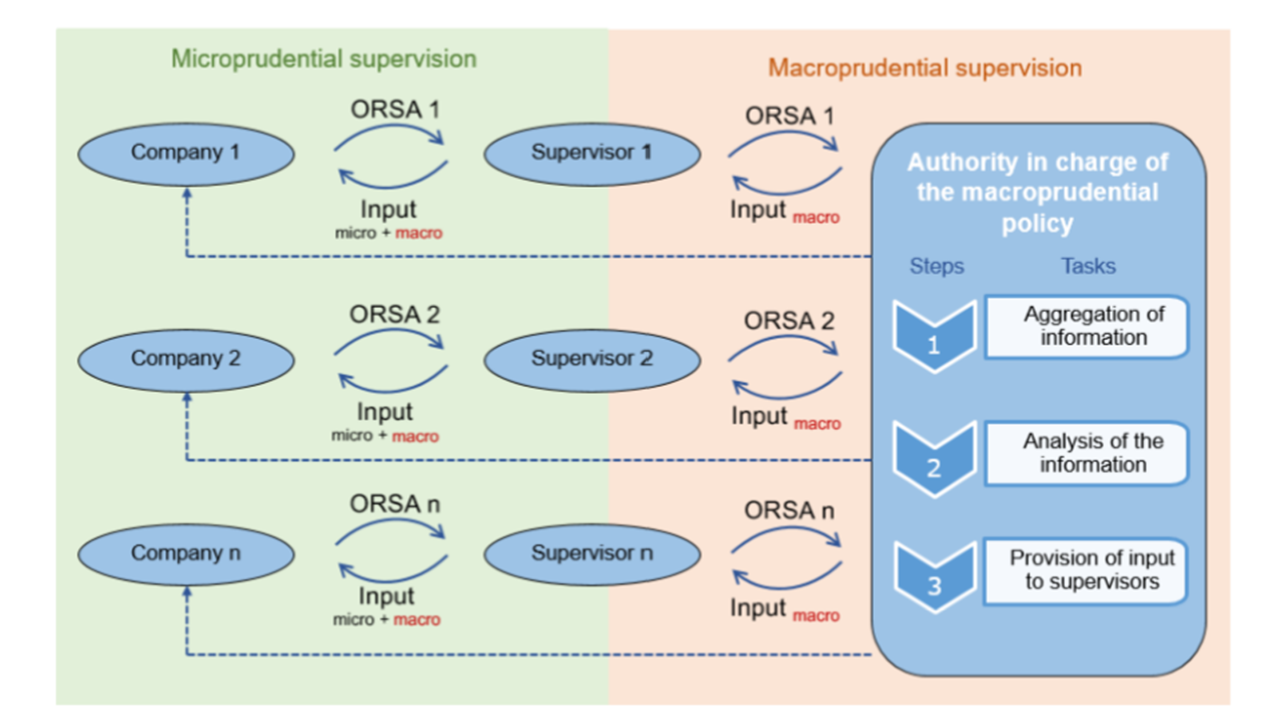
  • Indicators: Macro-prudential risk indicators or conduct indicators may provide additional insights and help the undertaking form its view on the future development of sustainability risks. Especially over a longer horizon, sustainability risk could have a wider and compounding impact on the economy and interactions between the financial and the real economy would need to be considered. For example, indirect impacts of climate change could lead to increase in food prices, migration, repricing of assets and rising social inequalities. All these indirect drivers will, in turn, impact the real economy as well as the financial sector, even more so as they could also trigger political instability. Macroprudential concerns could include, for example, plausible unfavourable forward-looking scenarios and risks related to the credit cycle and economic downturn, adverse investments behaviours or excessive exposure concentrations at the sectoral and/or country level. For example, EIOPA financial stability and conduct ESG risk indicators can be used to assess the external environment and business context in which climate change-related risks/opportunities can arise for the undertakings, the risk indicators will give an indication of macro-prudential risk in the insurance sector, and potential ESG related developments at sector level to the detriment of consumer protection.
  • Interlinkages: For example, increasing temperatures leading to increased mortality risk affecting health business can potentially create underwriting as well as legal transition risk if the conditions for triggering a liability insurance have been met (e.g. a company failing to mitigate/adapt the risk). But also, a sharp increase in physical risks can lead to public policies focusing on a faster economy transition, leading in turn to higher transition risks. Physical and transition risks can impact economic activities, which in turn can impact the financial system. At the same time, the interconnectedness of the financial sector, and more generally of the economy, can create secondary effects: physical risk reducing the value of property, reducing in turn the value of collateral for lending purposes or increasing the cost of credit insurance, leading to economic slowdown; or physical damage caused by extreme weather events to critical infrastructure increasing the potential for operational/IT risks, amplifying supply chain disruption and disruption to global production of goods.

Based on the narrative, through qualitative and quantitative analyses, undertakings should arrive at an assessment of the materiality of their exposure to sustainability risks. A qualitative analysis could provide insight in the relevance of the main drivers in terms of traditional prudential risks. A quantitative analysis could assess the exposure of assets and underwriting portfolios to sustainability risk.

Exposure assessment

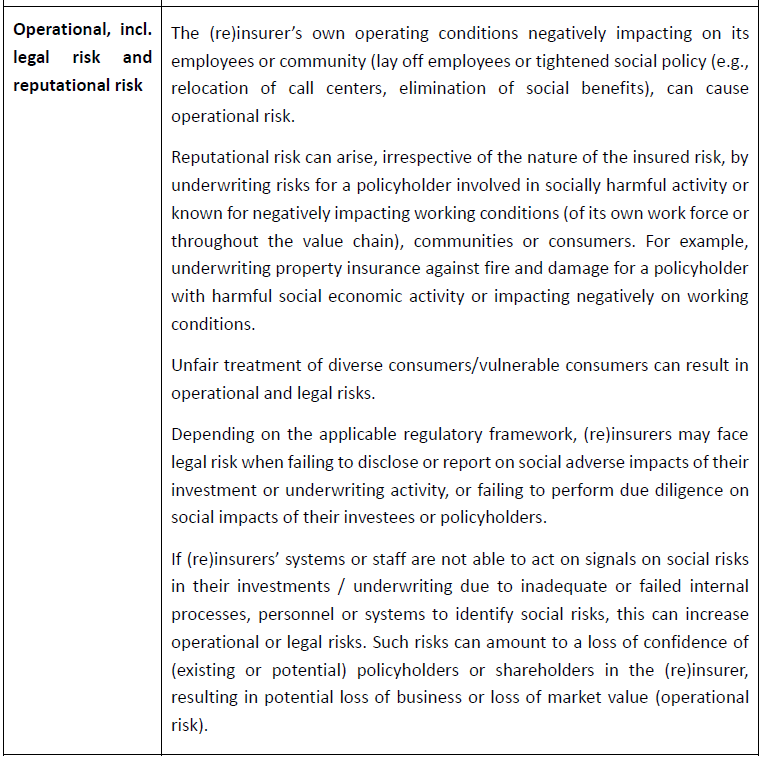
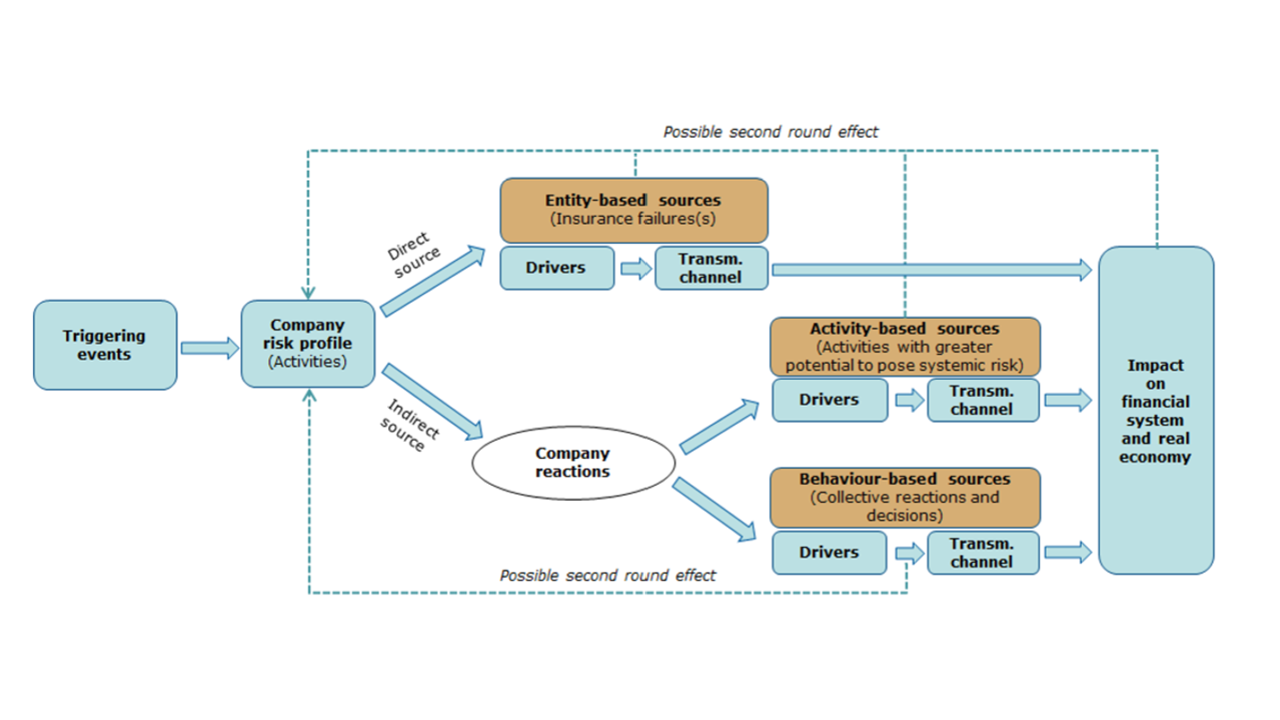
The aim is to identify sustainability risk drivers and their transmission channels to traditional prudential risks (i.e. market risk, counterparty risk, underwriting risk, operational risk, reputational risk and strategic
risk). Additionally, the assessment should provide insight into (direct) legal, reputational or operational risks or potential (indirect) market or underwriting risks, which could arise from investing in or underwriting activities with negative sustainability impacts, or from the undertaking misrepresenting its sustainability profile in public disclosure.

  • Qualitative analysis to help identifying the main drivers of climate change risks:
    • Transition risk drivers include changes in policies, technologies, and market preferences as well as the business activities of investees and commercial policyholders and policyholder preferences. At macro level, it may include consideration of failure of national governments to meet transition targets.
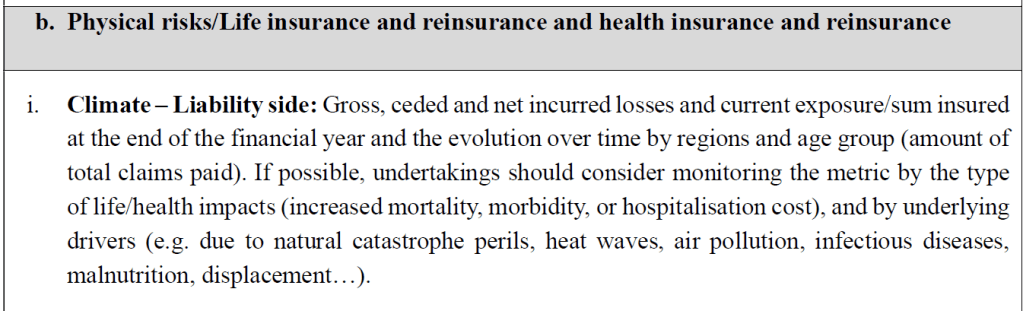
    • Physical risk drivers include level of both acute and chronic physical events associated with different transition pathways and climate scenarios. This involves assessing the impact of physical risks to counterparties (investees, policyholders, reinsurers) as well the insurer’s own operations (e.g.to insurer’s business continuity, also for outsourced services). For climate change-related risks, the assessment should consider the evolution of extreme weather-related events for insurers underwriting natural catastrophe risks (incl. in property and health insurance).
  • Geographical exposure: Identify potential exposure of assets or insured objects to sustainability risk based on, for example, the location of operations, assets or insured objects or supply chain dependencies of investee companies in geographical areas, regions or jurisdictions prone to (physical) climate, other environmental or social risks.
    • Natural catastrophe and environmental risk datahubs such as the Copernicus datasets on land (use) or biodiversity can give an indication of relevant environmental risks across regions.
    • Social risk indicators identify countries or regions that are vulnerable to social risk, measure social inequality or development. These can give an indication on potential social risk exposure of assets or liabilities located in those regions.
  • Economic activity/sector-based exposure: Identify potential exposure of assets or lines of business or insured risks to potential sustainability risks based on the impact of the investee (or supply chain dependencies of the investee) or the policyholder’s economic activity, or their dependency on environmental or social factors. Such assessment should however not only focus on for example, exposures to climate related sectors, but also to other sectors which may be indirectly affected by (transition) risks.
    • Alignment of the economic activity with the climate and environmental objectives and screening criteria set out in the Taxonomy Regulation and Climate, Environmental Delegated Regulations, as supported by the taxonomyrelated disclosures.
    • Biodiversity loss, a high-level exposure assessment of could be carried out using the level of premiums written in economic sectors with a high dependence on ecosystem services and/or a high biodiversity footprint (economic exposure) and the probability of occurrence of the associated nature-related risk factors.
    • Social risks, exposure of assets or liabilities to economic activities in ‘high risk social sectors’, can be identified by referring to the Business and Human Rights Navigator (UN Global Compact), which can help mapping exposure to sectors at high risk of relying on child labour, forced labour, or sectors negatively impacting on equal treatment (incl. restrictions to freedom of association) or on working conditions (inadequate occupational safety and health, living wage, working time, gender equality, heavy reliance on migrant workers) or have negative impacts on indigenous people.

Financial risk assessment

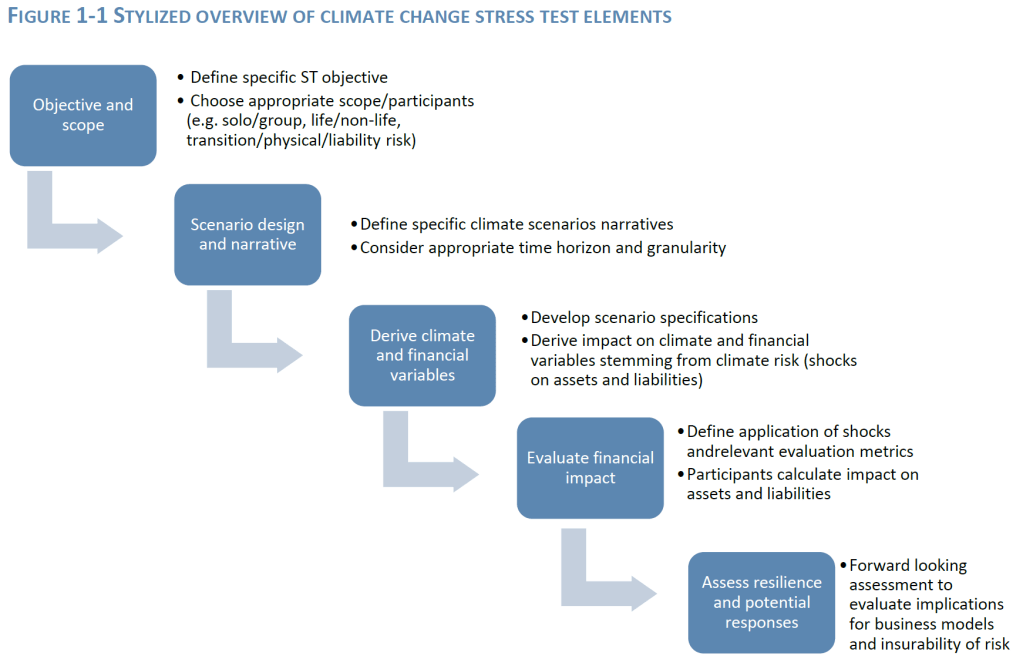
Where the exposure is deemed material, based on the thresholds set by the undertaking, a more detailed evaluation of the financial risks combining quantitative and/or qualitative approaches should inform the financial impact on the undertaking’s balance sheet. Here the assessment should aim to identify the key financial risk metrics and provide a view of the expected impact of such risks under different scenarios and time horizons at various levels of granularity.

Scenarios

When assessing the potential financial impact of material sustainability risks, the RTS sets out that undertakings should specify at a minimum two scenarios that reflect the materiality of the exposure and the size and complexity of the business. One of the scenarios should be based on the narrative
underpinning the materiality assessment. Where relevant, the scenarios should consider prolonged,
clustered, or repeated events
, and reflect these in the overall strategy and business model including
potential stresses linked to the

  • availability and pricing of reinsurance,
  • dividend restrictions,
  • premium increases/exclusions,
  • new business restrictions,
  • or redundancies.

For climate change risks, the Solvency II Directive requires undertakings with a material exposure to climate change risks to specify at least two long term climate change scenarios:

(a) a long-term climate change scenario where the global temperature increase remains below two degrees Celsius;

(b) a longterm climate change scenario where the global temperature increase is significantly higher than two degrees Celsius.

Experience to date shows that the most used scenarios are those designed by NGFS43, IPCC Shared Socioeconomic Pathways (SSPs) or tailor-made scenarios (set by regulators, e.g. for nature-related scenarios or for stress testing purposes.

Time horizons

The time horizon should ensure that the time horizon for analysing sustainability risks is consistent with the undertaking’s long-term commitments. The time horizon should allow to capture risks which may affect the business planning over a short-to-medium term and the strategic planning over a longer term.

The time horizon chosen for the materiality assessment in sustainability risk plan should also enable the integration of the risk assessment process with time horizons applied for the purposes of the ORSA for risk assessment purposes.

Taking the example of the impact of climate change: its impact can materialise over a longer time horizon than the typical 3-5 years (re)insurers’ strategic and business planning time horizons considered in the ORSA. It is argued that ORSA time horizons are too short to integrate the results of such longer-term climate change scenarios. Nevertheless, the ORSA should allow for the monitoring of the materialisation of risks over a longer term. At the same time, climate change-related risks and opportunities can affect the business planning over a short term and the strategic planning over a longer term.

The RTS specify the time horizons for sustainability risk assessment, to promote supervisory convergence and increase the consistency of risk assessment across undertakings and with decisionmaking. For this purpose, the RTS stipulates that the following time horizons for the sustainability risk assessment apply:

  • Short term projection: 1-5 years
  • Medium term projection: 5-15 years
  • Long term projection: min. 15 years

Documentation and data requirements

The sustainability risk assessment should be properly documented. This would include documenting the methodologies, tools, uncertainties, assumptions, and thresholds used, inputs and factors considered, and main results and conclusions reached.

Undertakings’ internal procedures should provide for the implementation of sound systems to collect and aggregate sustainability risks-related data across the institution as part of the overall data governance and IT infrastructure, including to assess and improve sustainability data quality.

Undertakings would need to build on available sustainability data, including by regularly reviewing and
making use of sustainability information disclosed by their counterparties, in particular in accordance with the CSRD or made available by public bodies.

Additional data can be sourced from interaction with investees and policyholders at the time of the
investment or underwriting of the risk
, or estimates obtained from own analysis and external sources.
Undertakings should, where data from counterparties and public sources is not available or has shortcomings for risk management needs, assess these gaps and their potential impacts. Undertakings
should document remediating actions, including at least the following: using estimates or (sectoral) proxies as an intermediate step – the use of such estimates should be clearly indicated – , and seeking to reduce their use over time as sustainability data availability and quality improve; or assessing the need to use services of third-party providers to gain access to sustainability data, while ensuring sufficient understanding of the sources, data and methodologies used by data providers and performing regular quality assurance.

Frequency

The RTS aim to align the frequency of performance of the materiality and financial risk assessments
with, on the one hand, the cycle of the submission of the regular supervisory report to the supervisor ‘at least every three years’, if not stipulated differently by the supervisor, and the requirement for undertakings to assess material risks as part of their ORSA ‘regularly and without any delay following any significant change in their risk profile’.

Significant changes to the undertaking’s risk profile can include material change to its business environment including in relation to sustainability factors, such as significant new public policies or shifts in the institution’s business model, portfolios, and operations.

In addition, for the frequency of the financial risk assessment, the RTS need to consider that undertakings (except for SNCUs) are required to conduct at regular intervals, at a minimum every three years, the analysis of the impact of at least two long-term climate change scenarios for material climate change risks on the undertaking’s business.

Based on these considerations, the RTS set out that the materiality and financial risk assessment should be conducted at least every three years, and regularly and without any delay following any significant change in their risk profile.

Building on the requirements , the RTS specifies that key metrics and the results of the sustainability risk
plan should be disclosed at least every year
or, for smaller and non-complex undertakings, at least every two years or more frequently in case of a material change to their business environment in relation to sustainability factors.

Metrics

Prescribing a list of metrics in sustainability risk plans can help

  • in promoting risk assessment,
  • improve comparability of risks across undertakings,
  • promote supervisory convergence in the monitoring of the risks and
  • enable relevant disclosures.

At the same time, it is important to allow undertakings flexibility in defining their metrics to avoid missing useful undertaking-specific information. Therefore, the RTS describes the key characteristics of the metrics and provides a minimum list of relevant metrics to compute.

Backward-looking (current view) and forward-looking, can be tailored to the undertaking’s business model and complexity, while following key characteristics apply. Metrics should

  • provide a fair representation of the undertakings’ risks and financial position using the most up-to-date information.
  • be appropriate for the identification, measurement, and monitoring of the actions to achieve the risk management targets.
  • be calculated with sufficient granularity (absolute and relative) to evaluate eventual concentration issues per relevant business lines, geographies, economic sectors, activities, and products to quantify and reflect the nature, scale, and complexity of specific risks.
  • allow supervisors to compare and benchmark exposure and risks of different undertakings over different time horizons.
  • be documented to a sufficient level to provide relevant and reliable information to the undertaking’s management and at the same time be used as part of supervisory reporting and, where relevant for public disclosure, ensuring sufficient transparency on the data (e.g. source, limitations, proxies, assumptions) and methodology (e.g. scope, formula) used.

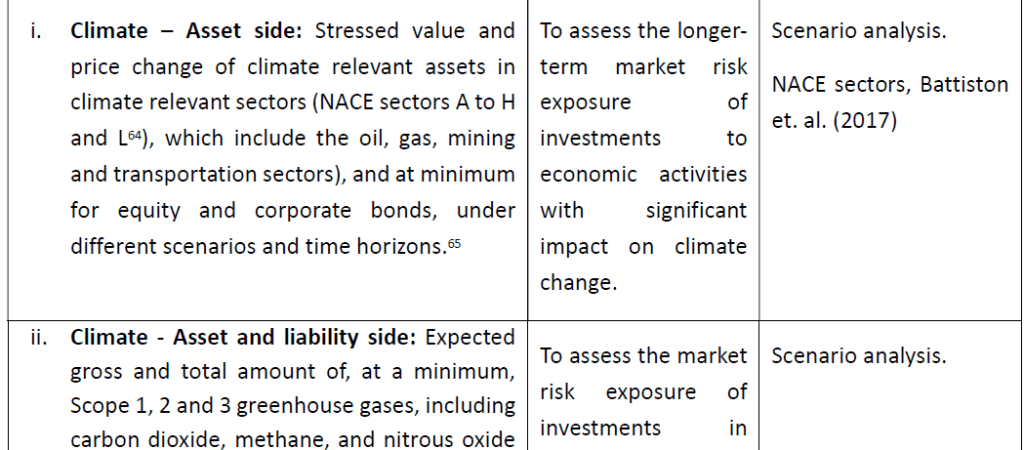
The RTS requires the following minimum current view metrics:

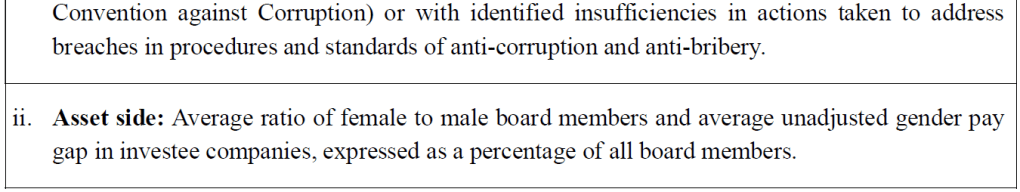
The following list includes optional metrics which could be considered by the undertaking on a voluntary basis to report on the results of scenarios analysis (financial risk assessment) for material sustainability risks.

Targets

Based on the results of the sustainability risk assessment, the undertaking’s risk appetite and long-term
strategy
, the undertaking should set quantifiable targets to reduce or manage material sustainabilityrelated exposure/risks or limits sustainability-related exposure/risks to monitoring prudential risks over the short, medium, and long term.

The undertaking should, based on its risk appetite, specify the type and extent of the material sustainability risks the undertaking is willing to assume in relation to all relevant lines of business, geographies, economic sectors, activities and products (considering its concentration and diversification objectives) and set its risk management targets accordingly.

Undertakings shall explain the way the target will be achieved or what is their approach to achieve the
target. Intermediate targets or milestones should allow for the monitoring of progress of the undertaking in addressing the risks. The undertakings should specify the percentage of portfolio covered by targets.

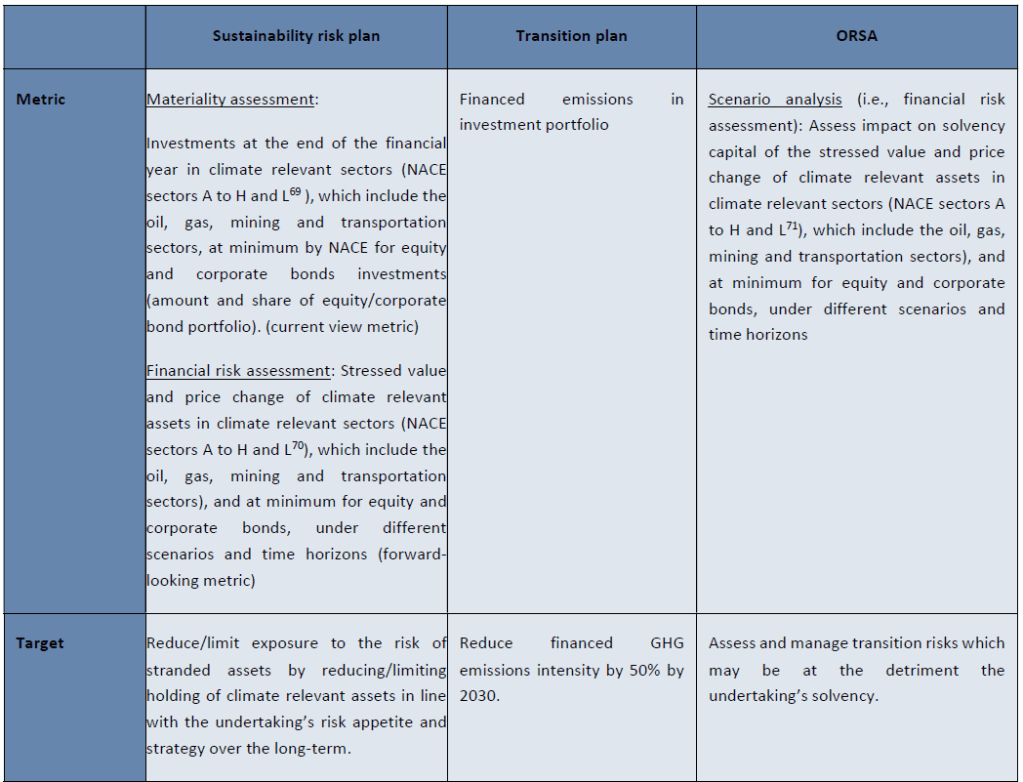
The targets should be consistent with any (transition) targets used in the undertaking’s transition plans and disclosed where applicable. The targets and measures to address the sustainability risks will consider the latest reports and measures prescribed by the European Scientific Advisory Board on climate change, in particular in relation to the achievement of the climate targets of the Union.

Relation between targets, metrics, and actions across transition plans, sustainability risk plans and ORSA, applied to an example for transition risk assessment for climate risk-related investments

Actions

Actions to manage risks should be risk-based and entity-specific.

  • Actions set out in undertakings’ transition plans, for example under CSDDD can inform the sustainability (transition) risk to the undertaking’s business, investment, and underwriting. Such transition plan actions typically involve:
  • Limiting investment in non-sustainable activities/companies Introduction of sustainability criteria in the investment decision.
  • Re-pricing of risks.
  • Integrating sustainability into the investment guidelines.
  • Stewardship, impact investing, impact underwriting.
  • Integrating ESG into the underwriting standards and guidelines of the undertaking.
  • Product development considering the impact on climate change.

The measures in the transition plan and actions to address financial risks arising from the transition need to be integrated into the investment, underwriting and business strategy of the undertaking. They need to be measurable and where actions fail to meet their expressed target, these should be monitored and, where necessary, adjusted.

Towards a European system for natural catastrophe risk management

EIOPA / ECB December 2024

Executive Summary

Increased economic exposure and the growing frequency and severity of natural catastrophes linked to climate change have been driving up the cost of natural catastrophes in Europe. Between 1981 and 2023, natural catastrophes caused around €900 billion in direct economic losses within the EU, with one-fifth of these losses having occurred in the last three years alone. However, over the same period, only about a quarter of the losses incurred from extreme weather and climate-related events in the EU were insured – and this share is declining.

This “insurance protection gap” is expected to widen further due to the increasing risk posed by climate change. Europe is the fastest-warming continent in the world and increasing climate risk is likely to have implications for both the supply of and demand for insurance if no relevant measures are in place. As the frequency and severity of climate-related events grow, (re)insurance premiums are expected to rise. This will make insurance less affordable, particularly for low-income households. Climate change also increases the unpredictability of these events, which may prompt insurers to stop offering catastrophe insurance in high-risk areas. At the same time, low risk awareness and reliance on government disaster aid further dampen insurance uptake by households and firms.

Recent events, such as the 2024 flooding in central and eastern Europe and in Spain, have further illustrated the challenges that extreme weather events can pose for the EU and its Member States. These events highlight the importance of emergency preparedness, risk mitigation, and adaptation efforts to prevent and/or minimise the losses from natural disasters, as well as the relevance of national insurance schemes in reducing the economic impact of natural catastrophes. They also bring to the fore the importance of addressing the insurance protection gap and the associated burden on public finances.

National schemes aim to broaden insurance coverage and encourage risk prevention. Typically, they do so by setting up risk-based (re)insurance structures involving public-private sector coordination for multiple perils (e.g. floods, drought, fires and windstorms). Some of the schemes further support the availability of insurance through mandatory insurance coverage and improve the affordability of insurance through national solidarity mechanisms. At the same time, there are fewer risk diversification opportunities at national than at EU level and reliance on both national and EU public sector outlays has been growing. Therefore, it is beneficial to discuss at EU level how adaptation measures can help in proactively reducing disaster losses and how the sharing of losses between the public and private sectors can help in raising risk awareness and improving risk management before disasters occur.

Building on existing national and EU structures, the EIOPA and BCE spell out a possible EU-level solution composed of two pillars, firmly anchored in a multi-layered approach:

  • An EU public private reinsurance scheme: this first pillar would aim to increase the insurance coverage for natural catastrophe risk where insurance coverage is low . The scheme would pool private risks across the EU and across perils, with the aim of further increasing diversification benefits at EU level, while incentivising and safeguarding solutions at national level. It could bef unded by risk based premiums from (re)insurers or national schemes , while taking into account potential implications of risk based pricing for market segmentation . Access to the scheme would be voluntary. The scheme would act as a stabilising mechanism over time to achieve economies of scale and diversification for the coverage of high risks at the EU level, similar to an EU public private partnership.
  • An EU fund for public disaster financing: this second pillar would aim at improving public disaster risk management among Member States . Payouts from the fund would target reconstruction efforts following high loss natural disasters, subject to prudent risk mitigation policies, including risk adaptation and climate change mitigation measures. The EU fund would be financed by Member State contributions adjusted to reflect their respective risk profiles. Fund payouts would be condition al on the implementation of concrete risk mitigation measures preagreed under national adaptation and resilience plans. This would incentivise more ambitious risk mitigation at Member State level before and after disasters. Membership would be mandatory for all EU Member States.

Rising economic losses and climate change

Economic losses from extreme weather and climate events are increasing and are expected to rise further due to the growing frequency and severity of catastrophes caused by global warming. Between 1981 and 2023, natural catastrophe-related extreme events caused around €900 billion in direct economic losses in the EU, with more than a fifth of the losses occurring in the last three years (2021: €65 billion; 2022: €57 billion; 2023: €45 billion).

Europe is the fastest-warming continent in the world and the number of climate-related catastrophe events in the EU has been rising, hitting a new record in 2023. Moreover, climate change is already now affecting many weather and climate extremes in every region across the globe and its adverse impacts will continue to intensify. In the EU, all Member States face a certain degree of natural catastrophe risk and the welfare losses are estimated to increase in the absence of relevant measures to improve risk awareness, insurance coverage and adaptation to the rising risks.

Over the last ten years, the reinsurance premiums for property losses stemming from catastrophes have increased across all major insurance markets. In Europe, property catastrophe reinsurance rates have risen by around 75% since 2017. While there may be various factors affecting reinsurance prices, the increasing frequency and severity of events is likely to trigger further repricing of reinsurance contracts, which can in turn increase prices offered by primary insurers. The rising risks may even prompt insurers to retreat from certain areas or types of risk coverage. Moreover, since insurance policies are typically written for one year only, such repricing or insurance retreat may be abrupt. Reduced insurance offer is justified where risks become excessively high or unpredictable. In particular, insurance cannot palliate for inadequate climate adaptation, spatial planning and (re)building conventions.

At the same time, take-up of natural catastrophe insurance in the EU is declining among low-income households, thus increasing the pressure on governments to provide support in the event of a natural catastrophe. For instance, the share of low-income consumers with insurance for property damage caused by natural catastrophes has declined from around 14% to 8% since 2022. Affordability and budgetary constraints are the main reason why 19% of European consumers do not buy or renew insurance. Low-income households may also be disproportionately vulnerable to financial stress and are more likely to live in areas with increased exposure to environmental stress or natural catastrophes, due to the affordability of land and housing or limited resources to relocate to safer areas or invest in disaster-resistant housing. Insurance affordability stress might eventually also contribute to housing affordability issues, because if a larger portion of income is spent on insurance, a smaller portion is available for other expenses (e.g. rent). Therefore, solutions should consider vulnerability and consumer protection aspects.

Lessons from national insurance schemes

National schemes to supplement private insurance cover for natural catastrophes, such as PPPs, help improve insurance coverage and reduce the insurance protection gap. Looking at the European Economic Area (EEA), the share of insured losses tends to be higher in countries with such national schemes: the average share across countries with a national scheme is around 47%, while it is below 18% for those without a national scheme. Currently, eight EEA Member States have established a national scheme:

The schemes share the same objective: they all aim to enhance societal resilience against disasters. They typically do so by improving risk awareness and prevention, while increasing insurance capacity through more affordable (re)insurance.

While the design features vary by scheme, some of them are recurring:

  1. Scope: most national insurance schemes have a broad scope of coverage, which allows them to pool risks across multiple perils and assets. The majority also incorporate a mandatory element, requiring either mandatory offer or mandatory take up of insurance by law .
  2. Structure: the prevalent structure of national schemes is that of a public (re)insurance scheme. Most schemes offer complementary direct (re)insurance and are of a permanent nature.
  3. Payouts and premiums: national schemes are typically indemnity based (i.e. payouts are based on actual losses rather than quantitative/parametric catastrophe thresholds). Premiums are mostly risk based.
  4. Risk transfer and financing: the use of reinsurance by the schemes depends on the availabil ity and the cost of reinsurance, with national schemes increasingly facing issues over affordability. Public financing of the scheme is not an essential design feature.
  5. Risk mitigation and adaptation measures: initiatives to ensure proper coordination between the public and private sectors on risk identification and prevention are now emerging in response to climate change. Private and public sector responsibilities are typically divided, with the private market contributing its insurance expertise and modelling capacity, while the public sector provides the legal basis and operating conditions.

Lesson 1: an EU solution could cover a wider range of perils and assets across several Member States, thus allowing for greater risk pooling and risk diversification benefits than at a national level. This can be particularly relevant for small countries where a single catastrophe can affect the whole country and for countries without a national insurance scheme. By pooling catastrophe risk across different exposures, regions and uncorrelated perils within a single EU scheme, it may be possible to reap larger risk diversification benefits than could be achieved at national level. This would, in turn, reduce the required capital needed to back the risks and lower the cost of reinsuring them. Mandatory elements to boost the demand for or offer of insurance could further increase the risk diversification benefits and limit adverse selection. However, this would also require a certain degree of harmonisation of existing national practices.

Lesson 2: an EU-wide solution could include a permanent public-private reinsurance scheme to complement private sector or national initiatives. Setting up a public-private reinsurance scheme, as opposed to a private structure, would have the advantage that it could be accessed by a large range of entities: primary insurers, reinsurers and various national schemes. Therefore, such a scheme would require no harmonisation of existing national practices. Participation in such a scheme would be voluntary, so that the scheme supplements, rather than crowds out, private sector or national initiatives. Making the scheme permanent would allow for pooling risk over time, thus reaping even greater diversification benefits than if risks were pooled only across perils, asset types and Member States.

Lesson 3: an EU-wide solution could further support affordable risk-based premium setting, owing to the potentially sizeable risk diversification benefits that could be achieved across Member States. Given the significant heterogeneity in the risks faced by policyholders across Member States, flat premiums or premiums capped by law could imply a relatively high level of cross-subsidisation and solidarity, which might be difficult to agree upon at EU level. A risk-based approach at EU level could support additional risk diversification benefits achieved from risk pooling across Member States, time horizons, perils and asset types.

Lesson 4: since public funding mechanisms for disaster recovery are stretched and reinsurance prices have been rising, an EU solution could aim to finance itself through risk-based premiums and could explore tapping capital markets. In addition to collecting risk-based premiums (see Lesson 3), the scheme could explore tapping the capital markets by issuing catastrophe bonds or other insurance-linked securities. The catastrophe bonds could be indemnity-based or parametric (or both), depending on the further design features of the solution (e.g. whether it would provide indemnity-based or index-based payouts). The extensive risk pooling enabled by the EU solution could also allow for the issuance of catastrophe bonds that could be less risky and more transparent than many other catastrophe bonds, thus attracting a relatively wide set of investors. Ultimately, the EU solution could in principle be set up with no public financing or backstop.

Lesson 5: an EU solution could support both insurance and public sector initiatives geared towards risk mitigation and adaptation as part of a public-private concerted action. For instance, an EU solution could improve the availability, quality and comparability of data on insured losses across EU countries. It could also support the modelling of risk prevention and the integration of climate scenario analysis into estimates of future losses (both insured and uninsured) from natural disasters. The analysis of EU solutions might further promote the use and development of open-source tools, models and data to enhance the assessment of risks. In this context, care should be taken to prevent further market segmentation or demutualisation based on granular risk analysis, which could widen the insurance protection gap in the medium term.

A possible EU approach

An EU-level system could rest on two pillars, building on existing national and EU structures:

  1. Pillar 1: EU public private reinsurance scheme. Establishing an EU public private reinsurance scheme would serve to increase the insurance coverage for natural catastrophe risk. The scheme would pool private risks across the EU, perils and over time to achieve economies of scale and diversification at the EU level.
  2. Pillar 2: EU public disaster financing. The second pillar would look to improve public disaster risk management in Member States through EU contributions to public reconstruction efforts following natural disasters, subject to prudent risk mitigation policies, including adaptation and climate change mitigation measures

The EU public-private reinsurance scheme could help to provide households and businesses with affordable insurance protection against natural catastrophe risks, while also providing incentives for risk prevention. Embedded in the ladder of intervention, the design features of the scheme build on the five lessons learned from the analysis of the national schemes. The scheme seeks to (i) ensure coverage of a broad range of natural catastrophe risks, (ii) fulfil a complementary role to national and private market solutions, (iii) rely on risk-based pricing, (iv) reduce dependence on public financing in the long term, and (v) support concerted action on risk mitigation and adaptation.

The EU reinsurance scheme could seek to transfer part of the risks to capital markets via instruments such as catastrophe bonds. The market for these products is less developed in the EU than in North America. Part of the reason is the smaller scale of the issuances. The EU scheme could explore the feasibility of a pan-European catastrophe bond covering more perils than the bonds currently issued. This would serve the dual purpose of expanding the catastrophe bond market and bringing more niche risks directly to capital markets investors. The investors, in return, could benefit from the additional diversification offered by exposure to these risks relative to the risks currently covered.

Risk pooling is a fundamental concept in insurance, grounded in the law of large numbers. As independent risks are added to an insurer’s portfolio, the results become less volatile. For example, in a pool of insured vehicles, the actual number of accidents each year converges with the expected number as the size of the pool increases. In terms of capital, reduced volatility means lower capital needs and costs for the same level of protection. More diversified insurers can therefore offer cover at a lower price and given the level of capital, provide a higher level of protection.

The underlying risk (annual expected loss) remains unchanged when pooling risks together. However, the cost of covering or transferring the risk (cost of capital), along with the cost of information and operating costs, decreases with diversification and risk pooling. Operational costs are lower due to economies of scale, as they are shared among all participants in the pool. The cost of information is also lower , as the time and money required to obtain information can be shared among participants.

Solvency II requires insurers to hold sufficient capital to withstand a loss occurring with a
probability of 1 in 200 years.
In an example, using the Moody’s RMS Europe NatCat Climate HD
model, and based on the current insured landscape, the pooled portfolio shows a reduction of
around 40% in the 1 in 200 year return period losses (RPL) compared to the sum of individual
values for countries
. This reduction might be even larger if penetration of flood insurance increases. A similar analysis conducted by the World Bank, provid ing a framework for estimating the impact of pooling risks on policyholder premiums , supports these conclusions.

The EU disaster financing component would provide a complementary mechanism that governments could tap when managing natural catastrophe losses. Natural catastrophes can lead to significant costs for governments, including damage to key public infrastructure. The EU disaster financing component would help governments to manage a share of these expenses following a major disaster, thus supplementing their national budgetary expenditure. The component would cover damages caused to key public infrastructure that is inefficient or too costly to insure privately, with a view to supporting resilient reconstruction efforts and public space adaptation. Clear rules on contributions and conditions on the disbursement of the funds should encourage ex ante risk prevention by governments, to minimise the emergency relief and residual private risks that the government may need to cover following a major event.

Prudential Treatment of Sustainability Risks

December 13, 2023, EIOPA has published a Consultation Paper regarding potential amendments of the prudential treatment of sustainibility risks (EIOPA-BoS-23-460). The expected Article 304a of the Solvency II Directive mandates EIOPA to assess the potential for a dedicated prudential treatment of assets or activities associated substantially with environmental or social objectives, or harm to such objectives, and to assess the impact of proposed amendments on insurance and reinsurance undertakings in the European Union. EIOPA is required to submit a corresponding report to the Commission.

A discussion paper outlining the scope, methodologies, and data sources for the analysis has been published in 2022 as the first outcome of EIOPA’s work under this mandate. This consultation paper is the second outcome, based on the discussion paper’s public feedback received, together with the feedback received from the Platform on Sustainable Finance and the European Banking Authority (EBA). It will form the basis of the report envisaged to be submitted to the Commission after consulting the European Systemic Risk Board (ESRB).

EIOPA decided to focus its analyses on the following three conceptual areas that are considered to be appropriate for a risk-based analysis:

  • The first area of the analysis is dedicated to the potential link between prudential market risks in terms of equity, spread and property risk and transition risks.
  • The second area of the analysis focuses on the potential link between non-life underwriting risks and climate-related risk prevention measures, since the prudential treatment of assets or activities as referred to in the mandate includes insurance undertakings’ underwriting activities.
  • The third area of the analysis is related to the potential link between social risks and prudential risks, including market and underwriting risks.

As a kind of « disclaimer » EIOPA states that « since sustainable finance is an area characterized by an ongoing progress regarding data availability and risk modelling, certain natural limitations of the analysis exist at this stage« :

  • Firstly, the sample size of certain asset portfolios for the analysis is relatively small due to general data constraints that can hardly be overcome. Further to this, the limited sample size covered in the present analysis might not reflect the overall insurers’ exposure to transition risks, which could also materialize from indirectly held assets.
  • Secondly, since legally binding transition plans of firms, for instance in relation to the Corporate Sustainability Reporting Directive (CSRD), are not yet available, reliable firm-specific characteristics affecting the (long-term) transition risk exposures of firms are difficult to obtain as further input data for the analysis. In this respect, a sectoral classification approach is generally not able to model firm-specific transition risk characteristics, which would require a firm-level approach instead.
  • Thirdly, technical challenges for the analysis exist in isolating transition risks from other risk drivers, such as the impact of the Covid-19 shock on asset prices, which is an important determinant for the backward-looking analysis, but not for the forward-looking analysis.
  • Fourthly, the exact extent to which credit ratings reflect transition risks remains unclear at this stage, making it challenging in the case of the prudential treatment of spread risk in the Standard Formula whether a dedicated treatment would be justified.

By acknowledging the methodological limitations in the context of assessing sustainability risks from a prudential perspective, EIOPA, at this stage, does not recommend policy options in all areas studied in this consultation paper, and does not express a preference between the options proposed as regards equity and spread risk in relation to transition risk exposures.

Potential link between prudential market risks in terms of equity, spread and property risk and transition risks

The challenging question arises as to whether to rely on historic asset price data to conduct an empirical risk analysis (backward-looking) or to use model-based risk assessments, typically in terms of stress scenarios (forward-looking), or a combination of both.

The feedback EIOPA received to its 2022 discussion paper (« Discussion paper on physical climate change risks ») overall support for the methodologies outlined regarding the forward-looking analysis. Some respondents mentioned that the use of a model-based assessment can be subject to technical bias due to the model assumptions taken, and corresponding findings should be treated with caution regarding the conclusion on potential prudential implications. Several respondents suggested focussing only on a forward-looking assessment, since historic time series data might not be able to show a potential materialization of transition risks.

EIOPA considers forward-looking model-based risk assessments to offer valuable insights into the potential impact of transition risks on asset prices, particularly since historical asset price data may not fully reflect the dynamic nature of environmental externalities and the complexities of transitioning to a low-carbon economy. Market sentiment, technological advancements, regulatory changes, and societal awareness of climate issues can significantly influence transition risks in the future. A comprehensive model-based approach can complement historical data analysis and provide a holistic view of how transition risks may materialize in asset prices.

A forward-looking assessment requires models and assumptions regarding the future developments of climate change and the transition to a carbon neutral economy. In particular, uncertainty surrounds the nature and timing of policy actions, technological change and the extent to which financial markets are already reflecting a transition scenario in asset prices. In other words, the results and conclusions obtained can be quite sensitive to the choices adopted for such parameters and assumptions. To capture such uncertainty, researchers make use of scenario analysis to analyse a broad range of future states of the world.

A number of supervisory authorities – both at national and European level – have developed climate change scenarios to assess the exposure of financial institutions to climate risks in terms of transition risks. EIOPA studied several analyses of climate transition scenarios developed by ACPR/Banque de France, DNB, ECB/ESRB as well as EIOPA/2DII to build a conceptual framework for the forward-looking analysis presented in this section. EIOPA’s discussion paper in 2022 briefly summarised these studies21, whereof the main conclusions are:

  • The assessments make use of different scenarios. ECB/ESRB and ACPR/Banque de France use as a basis the climate scenarios developed by the Network for Greening the Financial System (NGFS), DNB developed its own bespoke shock scenario and the EIOPA/2DII sensitivity analysis makes use of transition scenarios developed by the International Energy Agency (IEA);
  • The analyses use two ways to measure the impact of disorderly transition scenarios by either comparing them with the baseline results for an orderly transition or with the current, no policy change pathways;
  • The forward-looking assessments employ several models to translate high-level climate scenarios into pathways for equity and corporate bond prices at sector level using either the NACE breakdown of economic activities or – in case of the EIOPA/2DII sensitivity analysis – fifteen climate-policy relevant activities;
  • The assessments exhibited substantial differences in exposures to transition risk for the various economic activities and technologies. On the one hand, equity exposures to mining and power generation would be fully stranded in the DNB combined policy and technology shock scenario. On the other hand, equity exposures to renewable energy would double in value in the EIOPA/2DII late and sudden policy shock scenario.

A mapping of the Transition Vulnerability Factors (TVFs) developed by the DNB on the NGFS’s transition risk scenarios to assess the potential exposure of economic activities to transition risks from a forward-looking and risk-oriented perspective. The TVFs capture the sensitivity of stock returns to forward-looking scenario-specific excess market returns, for instance in case of a rise in carbon prices or a technological shock. Based on this mapping exercise, the economic activities that seem to be particularly exposed to transition risk from a forward-looking perspective are the following:

  • B05-09 – Mining and quarrying (coal, lignite, crude petroleum, natural gas, etc.);
  • C19 – Petrochemical;
  • C22 – Manufacture of rubber and plastic products;
  • C23 – Manufacture of non-metallic mineral products;
  • C24 – Manufacture of basic metals;
  • D35 – Utilities (electricity, gas, steam and air conditioning supply);
  • H50 – Water transport and
  • H51 – Air transport.

It is important to differentiate economic activities that might be able to follow a transition to a low carbon economy in the future from those which might not. Indeed, in terms of carbon footprint, sectors related to the extraction, production, processing, transportation and reselling of fossil fuels will hardly be able to reduce their carbon emission levels as it is directly linked with their activity. In this regard, the Platform on Sustainable Finance (PSF) states that “the Platform recognizes there are other economic activities for which no technological possibility of improving their environmental performance to avoid significant harm exists across all objectives and which might be thought of as ‘Always Significantly Harmful’ activities”, referring particularly to economic activities B5 (Mining of coal and lignite), B8.92 (Extraction of peat) and D35.11 (Power generation from solid fossil fuels). According to article 19(3) of the taxonomy regulation, power generation activities that use solid fossil fuels do not qualify as environmentally sustainable economic activities.

Three possible types of transition scenarios can be envisaged in the coming decade:

  • An orderly type of transition scenario in which there is no or little impact on the real economy and financial sector. This type of scenarios consists of a timely and predictable path to a carbon-neutral economy with companies gradually adjusting their business models and capital stock to this new reality. An orderly transition is considered to be the baseline scenario in the ACPR and ECB/ESRB transition stress tests.
  • A disorderly type of transition scenario where there is a substantial impact on the real economy and – through their asset exposures to carbon-intensive sectors – the financial sectors. This type of scenarios tends to be characterised by unexpected, sudden and delayed actions to achieve carbon-neutrality. A disorderly scenario is generally considered to be a low probability, but yet plausible event.
  • A type of scenario where there is no transition or an insufficient transition to a carbon-neutral economy. Such a type of scenarios is also bound to have substantial negative impacts on the real economy and financial sector. Not due to transition risk, but as a consequence of a further increase in (acute) physical risks, like floods, fires and storms that may damage production facilities and disrupt supply chains.26 However, such risk differentials will materialise in another dimension, i.e. depending on the geographical location of companies rather than their carbon sensitivity.

Given that a disorderly transition poses the biggest transition risk, a prudential forward-looking VaR-analysis should focus on transition risk differentials relating to a disorderly scenario. Since it is difficult to estimate the probability of such a scenario, it is proposed to assess its impact under various annual probabilities of occurrence, e.g. ranging from 0.5% to 4.5% per year. To put these annual probabilities into a longer-term perspective, assume for example that the probability of an orderly transition amounts to 50% during the coming decade. The annual probabilities of 0.5-4.5% will then translate in a cumulative probability of 5-30% after 10 years, leaving a cumulative probability of no (or insufficient) transition of 20-45%.

Equity Risk: Backward-Looking Results

Results of the Broad Portfolio Allocation Approach

Results of the Narrow Portfolio Allocation Approach : CPRS (Climate Policy Relevant Sectors) – based Portfolio Allocation)

Overall, the fossil fuel sector shows a differentiated risk profile relative to the other sectors in terms of the highest VaR (-56.5%) in the relevant time period from 2010-2021. This sector includes the following NACE codes: B5, B6, B8.92, B9.1, C19, D35.2, H49.5, G46.71, which mainly relate to activities associated with the extraction of crude oil, natural gas and the mining of coal. A large number of studies underline that these activities, due to their inherent carbon intensity and limited potential to transition, tend to be more exposed to transition risks, as European economies gradually converge towards the objectives set out by the 2015 Paris Climate Agreement and the EU Green Deal.

Equity Risk: Forward-Looking Results

The forward-looking analysis uses the projected equity shocks for the different economic sectors being distinguished in:

  • the sudden (1) and delayed (2) transition scenarios of ACPR;
  • the policy shock (3), technology shock (4) and double (or combined) shock (5) scenarios of DNB;
  • the delayed transition (6) scenario of ESRB/ECB;
  • the disorderly transition (7) and ‘too little, too late’ (8) scenarios of IAIS.

In the Monte Carlo simulations, if a disorderly transition scenario materialises, a probability of 1/8 is attached to each of these eight specific scenarios occurring.

Equity Risk Differentials (Monte Carlo)

Spread Risk: Backward-Looking Results

Since the aggregation of various different economic activities into high-level portfolios as regards transition risk exposures appears suboptimal for assessing the potential for a risk differential, the assessment focuses on the narrow portfolio approach, in particular regarding fossil fuel-related bonds.

Spread Risk: Forward-Looking Analysis

In line with the forward-looking analysis for equity risk, the transition return shocks for corporate bonds for the different economic activities are derived from the disorderly transition scenarios of ACPR (sudden and delayed transition scenarios), DNB (policy, technology and double shock scenarios), ESRB/ECB (delayed transition scenario) and IAIS (disorderly and ‘too little, too late’ scenarios). In the Monte Carlo simulations, if a disorderly transition scenario materialises, a probability of 1/8 is attached to each of these eight specific scenarios occurring.

Spread Risk Differentials (Monte Carlo)

Stocks and Bonds: EIOPA’s Potential Policy Options

Based on the detailed analysis, EIOPA describes and evaluates three potential options for both asset classes:

Equity Risk (options and EIOPA’s evaluation)

  • Option 1: “no change”-option
  • Option 2: treating fossil fuel-related stocks as Type II (stocks listed outside EEA and OCDE markets) equity, i.e., a capital charge of 49% rather than 39% for Type I equities;
  • Option 3: a dedicated supplementary capital requirement to the current equity risk calibration with supplementary capital charge to the current Standard Formula’s risk charge of 39%, in case of Type I equities, could lie in the range up to 17% in additive terms, i.e., 39%+17%=56%. Regarding the role of participations or long-term equity, exclusion criteria for fossil fuel-related activities or a potentially higher capital requirement may be needed to limit incentives to re-classify Type I/II stocks as participations for the sake of SCR reduction.

Spread Risk (options and EIOPA’s evaluation)

  • Option 1: no change option.
  • Option 2: a rating downgrade of bonds related to fossil fuel activities,
  • Option 3: a dedicated supplementary capital requirement to the current spread risk calibration, up to 5% in additive terms, which corresponds to an increase in the capital requirements of up to 40% relative to the bond portfolio’s current capital requirement.

An impact assessment conducted by EIOPA shows a very low impact of the proposed policy options on the solvency ratio of the undertakings (cumulated range equity and spread on Germany’s and France’s solvency ratios from -0.21 to -1.71%p) mainly due to the undertakings’ limited exposure to directly held fossil fuel-related assets. The low impact on the undertakings’ solvency ratio thereby suggests a limited impact on the asset allocations of undertakings in terms of potentially triggering fire-sales of fossil fuel-related assets that could contribute to systemic risks in the financial system. Moreover, it is important to note that besides capital charges, insurers take further criteria for their investment decisions into account, such as objectives in terms of duration and cash flow matching between assets and liabilities, further limiting the potential of the proposed policy options to trigger material re-allocations in the undertakings’ asset portfolios. It is therefore concluded that the proposed policy options would not materially contribute to systemic risks in the financial system.

Property Risk and Energy Efficiency

Regarding property risk, the Standard Formula in Solvency II currently foresees a shock to the market value of buildings of 25%. The shock has been calibrated as the annual 99.5%-Value-at-Risk (VaR) of monthly total return real estate indices and does not distinguish between commercial or residential real estate.

To study the potential effect of energy efficiency on property risk, EIOPA proposed in its discussion paper to construct property price indices based on samples of buildings with the same energy performance level, while controlling for major property characteristics typically driving the market value of a building. The energy performance-related price indices track the average price series of a specified reference building over time, and allow to calculate the corresponding annual returns. From a prudential perspective on property risk, a comparison of the annual Value-at-Risk values at the 99.5% confidence level across the energy performance-related price indices can provide evidence on a potential energy performance-related risk differential for property risk.

The two main variables of interest for the analysis are the building’s energy performance and its market value. EIOPA suggested in its discussion paper to use the building’s energy performance certificate (EPC) as a categorical measure of its level of energy efficiency. In this regard, the energy performance of a building is defined as the amount of energy needed to meet the building’s energy demand associated with a typical use of the building in terms of heating, cooling, ventilation, hot water and lighting. The EPCs typically range from A+ (most efficient) to H (least efficient), and using EPCs as a determinant for transition risk exposures was broadly supported in the public consultation. Moreover, energy performance certificates are also used as measure for the energy performance of buildings under the corresponding technical screening criteria of the EU Taxonomy.

The building’s market value, measured for the analysis as a building’s advertised sales price, is scaled by the building’s size (typically the square meter of living area for residential buildings) to reduce selection bias and to raise comparability of prices across buildings. Due to the impact of inflation on the market value of buildings, the building’s sales price in a given year is deflated for the analysis.

A range of factors can typically influence a building’s market value, such as location and age, and should be controlled for when grouping comparable buildings together to construct the house price indices. Generally, grouping data in relation to multiple house characteristics to reach homogeneous groups for comparison can materially limit the number of available price observations to construct respective price indices. In particular, residential buildings are typically infrequently sold during their lifetime, constraining materially the scope of building-specific time series data that could be used to track pricing effects. Therefore, a general tradeoff between complexity (granularity) in terms of building characteristics to construct homogeneous groups of buildings and the sample size arises, and a sufficient balance needs to be found.

To study the effect of a building’s level of energy efficiency on property risk from a backward-looking perspective, energy performance-specific property price indices based on the German residential housing market and advertisement data have been constructed.

The findings of EIOPA’s backward and forward-looking analysis together with a risk differentials based sensitivity study show an inconsistent effect of the level of energy efficiency on property risk in terms of the 99.5% Value-at-Risk of annual property returns. In contrast, the forward-looking analysis finds an increase in the riskiness of properties with energy labels F and G, i.e. the two least energy-efficient classes of property.

Since the quantitative findings from a backward- and forward-looking perspective show mixed evidence, EIOPA cannot conclude whether a dedicated prudential treatment of energy efficiency under the property risk sub-module in Solvency II’s Standard Formula could be justified.

As the analysis is subject to various data limitations that could not have been overcome by means of the public consultation of EIOPA’s discussion paper in 2022, EIOPA suggests a repetition of the analysis, particularly in context of the developments of the Energy Performance of Buildings Directive (EPBD), which aims for a consistent assessment of the energy efficiency of buildings in the EU and for improving corresponding data availability. It can therefore be expected that more data suitable for a property risk analysis as regards energy efficiency will be available in future.

Non-Life Underwriting and Climate Change Adaptation

The expected growth in physical risk exposures and insurance claims due to climate change will increase risk-based premium levels over time, potentially impairing the mid- to long-term affordability and availability of insurance products with coverage against climate-related hazards. Moreover, the increased frequency and severity of natural disasters and extreme weather events associated with climate change can make it more difficult for insurers to predict the likelihood of future losses accurately and to price insurance products appropriately.

Climate-related adaptation measures are defined as structural and non-structural measures and
services that are implemented by (re)insurance undertakings or policyholders ex-ante to a loss event, which reduce the policyholder’s physical risk exposure to climate-related hazards through

  • lowering the frequency of climate-related losses or
  • lowering the intensity of climate-related losses in an underwriting pool.

Climate-related adaptation measures can differ substantially regarding their form and ability to protect against climate-related hazards. Specific examples of climate-related adaptation measures discussed in the insurance context comprise:

  • measures related to a building’s structure like water-resistive walls, windows and doors or non-return valves on main sewer pipes against flood risk,
  • external building measures such as sandbags against flood risk,
  • heat- and fire-resistive construction materials for buildings against exterior fire exposures,
  • the irrigation of crop fields against drought risk and heat waves and
  • non-structural measures such as forecasting and warning systems (e.g., SMS) to enable policyholders to protect their goods in advance of severe weather events.

From a risk-based perspective, a clear link between climate-related adaptation measures and insurance premiums is given, as adaptation measures aim to reduce the policyholders’ physical risk exposures and insured losses associated with climate change, and thereby contribute directly to reducing the actuarial fair premium of an insurance contract. In contrast, climate-related mitigation measures focus on actions to reduce greenhouse gas emissions, for which a direct risk-based link to the actuarial fair premium does not necessarily exist. For instance, while motor insurance products focusing on electric vehicles contribute to reducing the emission levels associated with an underwriting pool, the lower emission levels do not directly affect the loss profile of the underwriting pool in terms of the frequency and intensity of claims. Therefore, climate-related mitigation measures are excluded from the scope of this analysis.

The prudential requirements for non-life underwriting risks in Solvency II’s Standard Formula comprise three main modules:

  • the premium – refers to future claims arising during and after the period of the solvency assessment (covered but not incurred, e.g., in relation to the provision for unearned premiums) – and reserve – refers to past risks and claims that have already materialized (provision for outstanding claims) – risk module,
  • the catastrophe module – potential losses from extreme and rare tail events, which are expected to happen more frequently and becoming more intense due to climate change – and
  • the lapse – instantaneous loss of 40% of the in-force business – risk module.

As per EIOPA, Particularly the first two modules can be considered materially sensitive to climate change and its impact on the frequency and intensity of severe weather- and natural catastrophe events. This statement can be challenged as we believe that increasing non affordability of insurance might well have an impact on lapse risk and feed-back on the consultation paper might well add it as being material.

Premium Risk

Premium risk in the Standard Formula is treated by means of a factor-based approach. In particular, the standard deviation of the underwriting pool’s loss ratio, which basically relates to the ratio of claims incurred to premiums earned, is driving the premium risk from a prudential perspective. The capital charge is determined to be consistent with the 99.5% percentile of the loss ratio’s distribution to cover unexpected shocks to the claims and premiums of the insurance undertaking in a given year.

Since climate change and its impact on physical risks materializes dynamically over time, for instance due to the dependance on changes in (global) temperature levels which in turn depend on greenhouse gas emission levels, historic data might not be an appropriate predictor of future trends, making it difficult for insurers to accurately predict the likelihood of future claims.

Climate-related adaptation measures can reduce the frequency and severity of weather- and climate-related losses in an underwriting pool and thereby smooth the claim’s distribution and lower the standard deviation of the loss ratio. In that regard, the risk of mispricing insurance policies due to climate change could be reduced, as the adaptation measures limit the potential for claims realizing in a given year to deviate materially from the expected outcome on which the premium level of the underwriting pool has been set before. The volume measure in terms of the net premiums earned is the second factor in the Standard Formula to determine premium risk from a prudential perspective and can be interpreted as a measure to scale the overall level of premium risk and the corresponding capital charge for the individual insurance undertaking. As the premium level of an underwriting pool is based on the expected volume of claims in a given year, the volume measure covers the expected losses.

Reserve Risk

Reserve risk captures the risk that the absolute level of claims provisions for an underwriting pool could be mis-estimated, i.e., that reserves are not sufficient to settle down the claims that occurred already in the past. As for premium risk, reserve risk is supposed to cover small to medium loss events and not tail events.

The prudential reserve risk is measured by means of a volume measure (net provisions for claims outstanding) and a parameter for standard deviation for the claim payments. Climate-related adaptation measures are expected to reduce the volume measure in terms of the net provisions for claims outstanding. Hence, the expected effect of adaptation measures on insurance reserves will be captured by the volume measure. The variation of costs to settle down claims that have already occurred in the past, however, does not seem to be materially affected by the fact of implementing climate-related adaptation measures in insurance products. Therefore, it is not expected that climate-related adaptation measures will have an impact on the standard deviation parameter driving reserve risk and is therefore studied only qualitatively.

Natural Catastrophe Risk

Under Solvency II, undertakings can take the risk reducing effect of climate-related adaptation measures into account when applying a suitable internal natural catastrophe model for estimating the corresponding capital requirements, but not under the Standard Formula. However, the effects of climate-related adaptation measures on the solvency capital requirements for natural catastrophe risk are difficult to predict, as they depend substantially on the catastrophe model used, the climate-related hazard considered, the risk characteristics of the adaptation measure modelled and the localisation of the risk exposure. Moreover, for example large-scale and expensive adaptation measures like flood-resistant walls might raise materially the value of a building, and thereby raise the sum insured, which in turn will raise the corresponding solvency capital requirement for natural catastrophe risk.

EIOPA focus un Premium Risk

Given the early stage of the EU insurance market regarding the implementation of adaptation measures in insurance products, particularly since current measures usually implemented are rather small-scale measures less effective against tail events captured by the natural catastrophe risk charge, but more effective against small and medium loss events captured by the premium risk charge EIOPA focuses its quantitative analysis on premium risk. Reserve risk and natural catastrophe risk are studied by means of qualitative questions that have been raised in the data collection with insurance undertakings in 2022. Future work could look more deeply into the quantitative influence of adaptation measures on the solvency capital requirements for natural catastrophe risk given further market progress in implementing adaptation measures in insurance products has been achieved providing sufficient data as regards their impact on claims related to tail events.

In order to study the influence of climate-related adaptation measures on premium risk, the annual loss ratios are calculated, both for portfolios with and without adaptation measures based on the 33 responses including data for 15 million policyholders of EIOPA’s 2022 consultation. Data is grouped into three main categories of climate-related adaptation measures for illustrative reasons:

  • Hail nets, tempered glass and garages, which have a conceptually similar effect against hail risk – referred to as the “Hail protection”-group
  • Weather warning systems (e.g. SMS, e-mail, etc.) – referred to as the “Warning systems”-group
  • Other adaptation measures (e.g. building codes) – referred to as the “other adaptation”-group

Standard deviation on Premium Risk

EIOPA’s Summary and Policy Recommendation

The sample for the analysis is very small, as it comprises only eleven underwriting pools. The EU insurance market is at a relatively early stage regarding the implementation of climate-related adaptation measures as defined in this exercise, which naturally limits the amount of potential data to be studied. In this regard, the Standard Formula’s requirement of at least five years of data for the assessment of the standard deviation parameter further constrained the scope of underwriting pools eligible for the analysis. Therefore, it is likely that the data sample studied does not fully capture the effects of adaptation measures, particularly in context of potential variations in terms of adaptation measures, climate perils, spatial exposures, etc.

At this stage, EIOPA does not recommend changing the prudential treatment of premium risk in context of climate-related adaptation measures. Due to the importance of climate-related risk prevention to ensure the long-term availability and affordability of non-life insurance products, EIOPA suggests a repetition of the analysis, provided that the availability of data has improved resulting from further market developments in this regard. In addition, an extension of the prudential analysis to the solvency capital requirements for natural catastrophe risk is suggested.

Social Risks and Impacts from a Prudential Perspective

EIOPA provides an initial analysis of the Pillar II and III requirements under Solvency II, to identify potential areas for further work. Given the material lack of social-related data and risk models regarding the social aspects of investment and underwriting activities of insurers, EIOPA did not conduct a Pillar I-related assessment in response to the mandate.

Social sustainability factors.

Social sustainability factors are commonly referred to in respect of “social and employee matters, respect for human rights, and anti-corruption and anti-bribery matters”.

SFDR (Sustainable Finance Disclosure Regulation) lists the following families of factors also used in the ESRS (European Sustainable Reporting Standards):

Social Impacts

The SFDR social adverse impacts include aspects as gender pay gaps between female and male employees, lack of workplace accident prevention policies, human rights policy or of a diligence process to identify, prevent, mitigate and address adverse human rights impacts.

The Social Taxonomy Report issued by the Platform on Sustainable Finance identifies as examples of socially harmful economic activity the involvement with certain kinds of weapons or the production and marketing of cigarettes.

Social Risks

Social risks refer to (financial) risks including those deriving from dependencies on human and social resources and those affecting working conditions and living standards, communities and consumers / end-users.

Social risks can arise from (macro-level) socio-economic developments as well as from entities or individual behaviour.

They can transmit into society

  • directly (e.g. events causing unemployment, health or security issues (such as pandemics, cyber threats)),
  • indirectly (‘second order’, e.g. rising price levels leading to financial distress, the risk of unemployment spreading into health or safety risks) and
  • through spill-over impacts (‘contagion’) affecting, for example, the financial system (e.g. unemployment leading to mortgage defaults, resulting in increased mortgage insurance pay outs and causing potential financial sector stability issues).

These risks can then transmit into risks for (re)insurance activities. For example, economic difficulties could lead to a decrease in the ability of citizens and companies to insure themselves or to pay their premiums.

Social Transition and Physical Risks

Social transition risk can result from the misalignment of economic activities with changes in policy, technology, legal requirements or consumer preferences which aim at addressing social negative impacts, such as for example inadequate working conditions or discrimination.

While social risks are primarily non-physical in nature, they can also give rise to physical / mental health consequences, especially when they affect working, safety and living conditions. Social risks related to inequality, discrimination, or human rights abuses can also for example lead to social conflicts which may have physical consequences in the form of property damage resulting from violence.

Social Risks for Insurers from a Prudential Perspective

Social risks can translate into prudential risks in the form of underwriting, market, operational (incl. legal) or reputational risks.

Pillar I Prudential Treatment

To perform a quantitative analysis to assess the potential for dedicated capital charges related to social risks, in line with risk- and evidence-based principles, would require large (international) consensus on appropriate definitions of risk channels as well as comprehensive and granular data on social risk factors in conjunction with appropriate risk models, which are not available to date. Hence, EIOPA does not conduct a Pillar I-related analysis in response to the expected mandate.

Pillar II Prudential Treatment

This chapter of EIOPA’s consultation clearly favours ORSA as being today’s most appropriate tool to deal with Social Risk Management. We agree with this initial strategy as it will enable regulators to build a real framework potentially impacting Pillar I and III within the next two to three years. However, based on the recent experience with ORSA, it would be useful to guide (re)insurance undertakings once the first ORSA reports including these issues filed to NCA. A Dry Run ORSA including these new criteria – like the one we experienced prior to 2016 – could be a good strategy to meet expectations.

High level social risk materiality assessment

(Re)insurers can conduct a high level (qualitative) social risk materiality assessment based on exposure to geographies, sectors or lines of business. The materiality of the exposure would form a proxy to vulnerability and materiality of the risk, in a first step of a risk materiality assessment.

  • Social risk – geographical exposure. For example, the Allianz social risk index118 identifies countries that are most vulnerable to systemic social risk. Indicators providing measures for social inequality or development can also provide indications on geographical exposure to social risks, such as the World Bank’s World Development Indicators featuring among others social indicators on labor, health, gender; the Gini index measures the distribution of income across a population; the UNDP human development indicator summarizes achievement in key dimensions of human development across countries.
  • Social risk – sectoral exposure. The exposure of assets or liabilities to economic activities in ‘high social risk sectors’. For example, the Business and Human Rights Navigator (UN Global Compact) can help mapping exposure to sectors at high risk of relying on child labour, forced labour, or sectors negatively impacting on equal treatment (incl. restrictions to freedom of association) or on working conditions (inadequate occupational safety and health, living wage, working time, gender equality, heavy reliance on migrant workers) or have negative impacts on indigenous people. For these issues, the Navigator identifies industry-specific risk factors, aiming to illustrate the issue for certain sectors such as agriculture, fashion & apparel, mining, travel & tourism. The navigator also identifies due diligence steps that companies can take to eliminate the specific social risks in their operations and supply chains. Information on the social sustainability of the economic activity the insurer is underwriting or investing in, can be sourced from companies’ corporate reporting on social risks and impacts under the Corporate Sustainability Reporting Directive (CSRD), as will be implemented by the European Sustainability Reporting Standards.
  • Social risk – insurance lines of business exposure. Some insurance lines of business may be particularly exposed to social risks. For example, the PSI ESG Underwriting Guide for Life and Health Insurance123 and the Geneva Association’s heat map of potential ESG risks in property and casualty underwriting124 identify social factors that may (negatively/positively affect) health or life and non-life insurance risks. Social adversity and lifestyle behaviour is known to affect health and with it, potential health insurance claims. Workers’ compensation claims are likely to be at risk of an employer’s poor work force policies. Other social/societal factors, such as housing insecurity or lack of education can influence (in)directly the outcome of workers’ compensation claims.

Practices for Mitigating Social Risks & Impacts: The Investment Strategy and Decisions

  • Limiting investment in or divesting from socially non-sustainable activities/companies: The exclusion of an investee harming social objectives from the investment portfolio can follow the identification of a socially harmful activity, based on two sources: internationally agreed conventions (e.g., certain kinds of weapons) or research on the detrimental effects of certain activities (e.g., detrimental effect of tobacco use). Thresholds for investments in such companies can be set, or exclusions from investments in these sectors pursued. Minimum social safeguards can serve as a guiding principle.
  • Impact investing and stewardship:
    • The (impact) investment strategy would direct investments at economic activities aiming to achieve explicitly social goals. For example, the funding of health research, through targeted investments in dedicated undertakings or investment in financial literacy programs may contribute to social objectives to improve living standards or access to relevant products to secure financial safety.
    • Engagement and voting on sustainability matters (as part of a stewardship approach) can aim to influence firms of which (re)insurers are shareholders. This supposes the (re)insurer can persuade the investee to act on social objectives and requires a certain degree of influence or leverage that the (re)insurer can reasonably exercise. (Re)insurers can use their engagement and voting rights to improve performance of those companies against the social objectives.
    • A ‘best-in-class strategy’ would consist in selecting investee companies with excellent social performance, regardless of the sector which they belong to. Such an investment approach can support companies to transition to a more socially sustainable business model. (Re)insurers can seek to ensure that those firms they invest in measure up to social objectives, especially in ‘high risk’ sectors, ensuring, for example that they provide appropriate wages, or that they operate safe working environments.
    • Such risk mitigating or adaptation actions can be informed by considering the SFDR principal adverse impacts of the investee companies’ activities. The so-called ‘minimum social safeguards’ as referred to in the Taxonomy Regulation can also provide a minimum standard for implementing a social prudent person principle for investments, in line with Solvency II.

Practices for Mitigating Social Risks & Impacts: The Underwriting Strategy and Decisions

  • Limiting underwriting of socially non-sustainable activities: Similar to investments, insurers could opt not to insure companies (belonging to a sector) known for unsustainable or harmful social practices in its own operations or value chain, or negatively impacting communities or consumers.
  • Impact underwriting and services: Through targeted underwriting activity, products and services, insurers could bring additional social benefits that directly contribute to the realization of social objectives for end-users and consumers as well as for affected communities (directly or through the value chain). There may be scope for insurers, through their underwriting strategy and decisions, to incentivize policyholders to manage losses arising from social risks. This may be through the provision of services or the potential reduction of premia for risk reducing measures taken by the policyholder, consistent with actuarial risk-based principles. Via underwriting, insurers could also ensure their product offerings and distribution practices consider the demands and needs of a diverse range of clients. Through their underwriting they need to ensure exclusions do not unfairly target and discriminate consumers with non-normative traits and/or vulnerable consumers.
    • For example:
      • The integration of social risk mitigants into, for example, surety bond underwriting for infrastructure projects can also contribute to reducing losses from underwriting due to social risks.
      • Risk mitigants can be part of underwriting conditions for workers’ compensation policies requiring companies to impact on the health of their workers through the pay they provide, the security of contracts they offer, and through the provision of benefits such as sick pay, parental leave, health insurance and other health-related schemes.
      • The establishment of sectoral risk sharing capacities at local, regional or national level, where applicable with government involvement, can contribute to social risk mitigation, for example by improving risk assessment for communities and societies and reducing losses from socio-economic risk events.

Pillar III Prudential Treatment

Considering the nascent reporting requirements on social risks and impacts under SFDR and CSRD, EIOPA is not proposing at this stage to develop additional (prudential Pillar III) reporting or disclosure requirements regarding social risks and impacts in Solvency II. Further analysis would be required as to whether quantitative prudential reporting requirements could inform the corresponding prudential treatment of (re)insurers assets and liabilities.

DORA: What the new European Framework for Digital Operational Resilience means for Business

On 10 November 2022, the European Parliament voted to adopt a new EU regulation on digital operational resilience for the
financial sector (DORA)
. With obligations under DORA coming into effect late in 2024 or early 2025 at the latest, in this briefing we take a closer look at its impact and consider what the regulation will mean for firms, their senior managers and operations and what firms should be doing now in preparation for day one compliance.

What is DORA?

Aimed at harmonising national rules around operational resilience and cybersecurity regulation across the EU, DORA establishes uniform requirements for the security of network and information systems of companies and organisations operating in the financial sector as well as critical third parties which provide services related to information communication technologies (ICT), such as cloud platforms or data analytics services.

DORA creates a regulatory framework on digital operational resilience whereby all in-scope firms need to make sure that they can withstand, respond to, and recover from, all types of ICT-related disruptions and threats. ICT is defined broadly to include digital and data services provided through ICT systems to one or more internal or external users, on an ongoing basis.

DORA forms part of the EU’s Digital Finance Package (DFP), which aims to develop a harmonised European approach to digital finance that fosters technological development and ensures financial stability and consumer protection. The DFP also includes legislative proposals on markets in cryptoassets (MiCA), distributed ledger technology and a digital finance strategy.

Who will need to comply with DORA?

DORA will apply to financial entities, including:

  • credit institutions,
  • payment institutions,
  • e-money institutions,
  • investment firms,
  • cryptoasset service providers (authorised under MiCA) and issuers of asset-referenced tokens,
  • central securities depositories,
  • central counterparties,
  • trading venues,
  • trade repositories,
  • managers of alternative investment funds and management companies,
  • data reporting service providers,
  • insurance and reinsurance undertakings,
  • insurance intermediaries,
  • reinsurance intermediaries and ancillary insurance intermediaries,
  • institutions for occupational retirement pensions,
  • credit rating agencies,
  • administrators of critical benchmarks,
  • crowdfunding service providers and
  • securitisation repositories (Financial Entities).

DORA will also apply to ICT third-party service providers which the European Supervisory Authorities (the European Banking Authority (EBA), the European Securities and Markets Authority (ESMA) and the European Insurance and Occupational Pensions Authority (EIOPA), acting through their Joint Committee) (ESAs) designate as « critical » for Financial Entities (Critical ICT Third-Party Providers) through a newly established oversight framework.

The ESAs would make this designation based on a set of qualitative and quantitative criteria, including:

  • the systemic impact on the stability, continuity or quality of financial services in the event that the ICT third-party
    provider faced a large-scale operational failure to provide its services;
  • the systemic character or importance of Financial Entities that rely on the ICT third-party service provider;
  • the degree of reliance of those Financial Entities on the services provided by the ICT third-party service provider in
    relation to critical or important functions of those Financial Entities; and
  • the degree of substitutability of the ICT third-party service provider.

Any ICT third-party service provider not designated as critical would have the option to voluntarily « opt in » to the oversight. The ESAs may not make a designation in relation to certain excluded categories of ICT third–party service providers, including where Financial Entities are providing ICT services

  • to other Financial Entities,
  • to ICT third–party service providers delivering services predominantly to the entities of their own group or
  • to those providing ICT services solely in one Member State to financial entities that are active only in that Member State.

What are the key obligations?

DORA introduces targeted rules on ICT risk management capability, reporting and testing, in a way which enables Financial Entities to withstand, respond to and recover from ICT incidents. In principle, some of the requirements imposed by DORA, such as for ICT risk management, are already reflected to a certain extent in existing EU guidance (for example, the EBA Guidelines on ICT and security risk management).

The proposals include requirements relating to:

  • ICT risk management

DORA sets out key principles around internal controls and governance structures. A Financial Entity’s management body will be expected to be responsible for defining, approving, overseeing and being continuously accountable for a firm’s ICT risk management framework as part of its overall risk management framework. As part of the ICT risk management framework, Financial Entities need to maintain resilient ICT systems, revolving around specific functions in ICT risk management such as

  • identification of risks,
  • protection and prevention,
  • detection,
  • response and recovery and
  • stakeholder communication.
  • Reporting of ICT-related incidents

DORA aims to create a consistent incident reporting mechanism, including a management process to detect, manage and notify ICT-related incidents. Incidents deemed « major » would need to be reported to competent authorities within strict time frames, including initial notifications « without delay » on the same day or next day by using mandatory reporting templates. In some cases, communication to service users or customers may be required.

  • Testing

As part of the ICT risk management framework, DORA requires Financial Entities to adopt a robust and comprehensive digital operational resilience testing programme covering ICT tools, systems and processes. Certain Financial Entities must carry out advanced testing of their ICT tools, systems and processes at least every three years using threat-led penetration tests.

  • Information sharing

DORA contains provisions which should facilitate the sharing, among Financial Entities, of cyber threat information and intelligence, including

  • indicators of compromise,
  • tactics,
  • techniques and procedures,
  • cyber security alerts and
  • configuration tools

to strengthen digital operational resilience.

  • Localisation

Financial Entities will only be permitted to make use of the services of a third-country Critical ICT Third-Party Provider if such provider establishes a subsidiary in the EU within 12 months following its designation as a Critical ICT Third-Party Provider.

A simplified set of ICT risk framework requirements will apply to certain Financial Entities, including small and non-interconnected investment firms and payment institutions exempted under the Second Payment Services Directive. Such entities will need to comply with a reduced set of requirements under DORA, including the requirement to put in place and maintain a sound and documented risk management framework that details the mechanisms and measures aimed at a quick, efficient and comprehensive management of all ICT risks, including for the protection of relevant physical components and infrastructures.

What should firms be doing now to prepare?

Although it is not expected that DORA will apply to in-scope entities until late 2024 (see below), firms should now begin
considering the steps that they will need to take to ensure day one compliance
. These include:

  • Scope out impact

Taking a risk-based approach reflective of their size, nature, scale and the complexity of their services and operations, Financial Entities should begin to scope out the impact of DORA on their business. Firms should carry out a comprehensive gap analysis of their existing ICT-risk management processes against the new requirements introduced by DORA to identify any aspects of their existing processes that will be impacted by the new requirements and develop detailed implementation plans setting out the steps that will need to be taken to effect relevant changes. As part of this, Financial Entities should ensure that they have in place appropriate:

(i) capabilities to enable a strong and effective ICT risk management environment;

(ii) mechanisms and policies for handling all ICT-related incidents and reporting major incidents; and

(iii) policies for the testing of ICT systems, controls and processes and the management of ICT third-party risk.

This process will be iterative as some of the more detailed requirements of DORA will be further developed through technical standards to be published by the ESAs in due course.

  • Critical ICT Third-Party Providers

Critical ICT Third-Party Providers will be required to have in place comprehensive, sound and effective rules, procedures, mechanisms and arrangements to manage the ICT risks which they may pose to Financial Entities. Although DORA provides that the designation mechanism (pursuant to which the ESAs may designate an ICT third-party service provider as « critical ») must not be used until the Commission has adopted a delegated act specifying further details on the criteria to be used in making such an assessment (to be adopted within 18 months after the date on which DORA enters into force), it is expected that certain categories of providers, such as cloud computing service providers who provide ICT services to Financial Entities, will be designated as Critical Third-Party Providers.

Consequently, such providers may wish to begin the task of benchmarking their existing systems, controls and processes against existing guidelines, such as the EBA Guidelines on ICT and security risk management and Guidelines on outsourcing arrangements, to the extent required, to identify areas that require further investment and maturity. They will also need to consider whether new and existing contracts give them sufficient flexibility to comply with new regulatory rules, orders and directions, even if this would otherwise be inconsistent with their contractual obligations. As set out above, certain categories of ICT third-party service providers are expressly excluded from the designation mechanism, including Financial Entities providing ICT services to other Financial Entities, ICT intra-group service providers and ICT third-party service providers providing ICT services solely in one Member State to Financial Entities that are only active in that Member State.

  • Third Country Critical ICT – Third-Party Providers – Subsidiarisation

The EU subsidiarisation requirement that will apply to third country Critical ICT Third-Party Providers is one that will necessitate early engagement between such providers and the Financial Entities that they serve. While it is not clear what role the EU subsidiary must play in the provision of services to the relevant Financial Entity (e.g. whether the provider must act as contractual counterparty), Recital 58 of DORA indicates that the requirement to set up a subsidiary in the EU does not prevent ICT services and related technical support from being provided from facilities and infrastructures located outside the EU. Nevertheless, where a relevant third country ICT third-party provider that is likely to be designated as « critical » indicates that it does not intend to establish a subsidiary in the EU, even following a designation as such by the ESAs, Financial Entities may wish to commence the process of identifying alternative providers, since they will not be permitted to obtain ICT services from a third country Critical ICT Third-Party Provider that fails to establish a subsidiary in the EU within 12 months following its designation as critical.

Companies that consider they are likely to be classified as Critical ICT Third-Party Providers that do not already have an establishment or subsidiary located in the EU should begin to consider now which Member State would be most appropriate to establish a new subsidiary in, taking into account their business operations and the various applicable legal requirements.

  • Documentation impact

As noted above, DORA sets out core contractual rights in relation to several elements in the performance and termination of contracts with a view to enshrine certain minimum safeguards underpinning the ability of Financial Entities to monitor effectively all risk emerging at ICT third-party level. Some contractual requirements set out in DORA are mandatory and will need to be included in contracts, if not already reflected. Others take the form of principles and recommendations and may require negotiation between the relevant parties. Early mapping and engagement in this respect will be important. Additionally, parties may wish to consider benchmarking their existing contractual arrangements against relevant requirements set out in DORA, as well as existing standard contractual clauses developed by EU institutions.

For example, Recital 55 of DORA notes that « the voluntary use of contractual clauses developed by the Commission for cloud computing services may provide comfort for Financial Entities and ICT third-party providers by enhancing the level of legal certainty on the use of cloud computing services in full alignment with requirements and expectations set out by the financial services regulation ».

As the industry awaits more detailed technical standards to be developed and published by the relevant ESAs, as well as DORA compromise/Level 1 text, in-scope entities may consider using existing guidelines such as the EBA Guidelines on ICT and security risk management and Guidelines on outsourcing arrangements as useful benchmarking tools in preparation for day one compliance.

How does DORA interact with NIS2?

The second iteration of the Security of Network and Information Systems Directive (NIS2) aims to strengthen security requirements and provide further harmonisation of Member States’ cybersecurity laws, replacing the original NIS Directive of 2016 (NIS1). Its timeline is similar to that for DORA, with a provisional agreement among EU institutions reached in May 2022, and its adoption confirmed in a European Parliament plenary session vote on 10 November 2022. NIS2 significantly extends the scope of NIS1 by adding new sectors, including « digital providers » such as social media platforms and online marketplaces, for example, but importantly also introduces uniform size criteria for assessing whether certain financial institutions (and other entities) fall within its scope. NIS2 sets out cybersecurity risk management and reporting obligations for relevant organisations, as well as obligations on cybersecurity information sharing, so there is some overlap in coverage with DORA.

However, this has been addressed during the legislative process to ensure that financial entities will have full clarity on the different rules on digital operational resilience that they need to comply with when operating within the EU. NIS2 specifically provides that any overlap will be addressed by DORA being considered as lex specialis (ie a more specific law that will override the more general NIS2 provisions).

How does DORA compare with international developments?

The introduction of DORA in the EU reflects a global focus on operational resilience and strengthening cybersecurity standards in the wake of ever-increasing digitalisation of financial services and increasingly sophisticated cyber incidents. For example, in March 2021, the Basel Committee on Banking Supervision issued its Principles for operational resilience, as well as an updated set of Principles for the sound management of operational risk (PSMOR), which aim to make banks better able to withstand, adapt to and recover from severe adverse events.

In October 2022, following a G20 request, the Financial Stability Board (FSB) published a consultation on Achieving Greater Convergence in Cyber Incident Reporting, recognising that timely and accurate information on cyber incidents is crucial for effective incident response and recovery and promoting financial stability and with a view to ensuring that financial institutions operating across borders are not subject to multiple conflicting regimes. The FSB proposals include recommendations to address the challenges to achieving greater international convergence in cyber incident reporting, work on establishing common terminologies related to cyber incidents and a proposal to develop a common format for incident reporting exchange.

Following its departure from the EU, the UK has introduced a Financial Services and Markets Bill (the UK Bill) which includes proposals to regulate cloud service providers and other critical third parties supplying services to UK regulated firms and financial market infrastructures. HM Treasury would have powers to designate service suppliers as ‘critical’ and the UK regulators would have new powers to directly oversee designated suppliers, which would be subject to new minimum resilience standards. While the proposals have the same ambitions as, and there are similarities with, the requirements under DORA, there are a number of key differences between them.

For example, the proposed enforcement regime under DORA for Critical ICT Third-Party Providers is very different from the equivalent regime proposed by the UK Bill. Under DORA, the ESAs will be designated as « Lead Overseers », but with the power only to make ‘recommendations’ to Critical ICT Third-Party Providers, in contrast to the ability for UK regulators to make rules applying to, or to give directions to, critical third parties subject to the UK Bill, with the ability to issue sanctions for non-compliance. Under DORA, non-compliance by a Critical ICT Third-Party Provider with recommendations gives the Lead Overseer the ability to notify and publicise such non-compliance and « as a last resort » the option to require Financial Entities to temporarily suspend services provided by such provider until the relevant risks identified in the recommendations have been addressed.

This means that the liability and contractual issues for Critical ICT Third-Party Providers providing services in the EU will be different than for those providing services in the UK, and that contracts for each will need to be considered and negotiated carefully.

Next steps and legislative timeline

Following adoption of DORA by the European Parliament plenary session on 10 November 2022, the regulation is now passing through the final technical stages of the formal procedure for European legislation. The text still needs to be formally approved by the Council of the EU before being published in the Official Journal, which is expected in December 2022 or January 2023.

DORA will come into effect on the twentieth day following the day on which it is published in the Official Journal. It will apply, with direct effect, 24 months from the date on which it enters into force. Therefore, it is expected that DORA will apply to in-scope firms from late 2024 or early 2025 at the latest.

The CEO’s Dilemma – Building Resilience in a Time of Uncertainty

Global disruptions and an increasingly complex macroeconomic outlook will be key elements of the strategic environment for the foreseeable future. For leaders, the only certainty is that waiting for clarity is a losing move. The best organizations know how to turn uncertainty into opportunity. Their playbook relies on two critical elements:

  • a shared and clear view of the world and the strategic challenges/opportunities it presents
  • and a resilient and adaptable plan to win.

A view of the world

Today’s global disruptions (e.g., geopolitical tensions, supply chain and economic headwinds (e.g., soaring inflation, rising interest rates, decelerating growth, and currency fluctuations)) have created a complex, once in a generation, competitive environment with significant variations across geographic areas and sectors.

Navigating this unprecedented complexity requires business leaders to develop a dynamic perspective not only on the most likely scenarios for how their operating and economic environments will evolve, but also on the distinct opportunities and risks these scenarios present for their organizations.

This research shows that “winners” in economic uncertainty do not just sit back and wait for recovery instead, they are proactive and turn ambiguity into opportunity.

A plan to win

There is no “one size fits all” solution to today’s complex strategic challenges. But this research suggests that the best companies do two things well in crafting their unique plans to win:

  • First, they have a clear understanding of their strategic starting point that takes into account nuanced and deaveraged perspectives on the economic and operational stability of the markets in which they operate as well as on their own organizations’ financial strength (e.g., profit volatility, free cash flow to debt ratio) ultimately falling into four high level starting point archetypes
  • And second, they embed a “dynamic strategy” mindset into their planning, comprising three elements:
    • Sensing: Observing trends, defining and monitoring critical uncertainties, and outlining a set of scenarios against which to assess business decisions
    • Adapting: Building operational and financial stability by shaping and reshaping strategies based on market trends and data driven forecasts
    • Thriving: Moving rapidly from assessment to action to seize growth opportunities and strengthen competitive advantage

Increasing uncertainty driven by a set of global disruptions and exacerbated by macroeconomic headwinds needs to be met head on.

Dramatic shifts in inflation drivers vary across regions and countries with energy emerging as one of the strongest drivers

Different sectors are affected differently by macro uncertainties

Sectors like agriculture are typically less vulnerable to business cycle shifts, while other sectors (e.g., media, tech, fashion) tend to be more affected. But this varies by recession depending on drivers.

Some sectors (e.g., retail), which were less vulnerable in the early 2000s recessions, are showing greater vulnerability in the current environment.

Top performers in economic uncertainty do not just wait for recovery; instead, they build competitive advantage and turn ambiguity into a source of opportunity.
Business leaders must balance contrasting priorities amid strong macroeconomic headwinds
Understanding the “starting point” is critical to successfully navigate this uncertainty

With the current disruptions and uncertainties, it is imperative for business leaders to reevaluate:

  1. The stability of their portfolio against economic downturns & market disruption
  2. The internal financial stability to cope with uncertainty

Each business context is distinct, but four starting-point archetypes can help leaders understand the moves most relevant for their organizations.

How to navigate uncertainty: Enhance resilience and secure clear pathway for sustained growth
The time to act is now

Take 3 key steps to navigate uncertainty and win in a downturn:

  1. Sensing macroeconomic and disruptive trends to shape (and reshape) future scenarios that guide strategic decisions
  2. Adapting business and functional strategies in response to new insights and to market, economic, and competitive developments
  3. Thriving by building competitive advantage to turn adversity into opportunity

Actions should be based on the specific business context.

Implementing combined audit assurance

ASSESS IMPACT & CREATE AN ASSURANCE MAP

The audit impact assessment and assurance map are interdependent—and the best possible starting point for your combined assurance journey. An impact assessment begins with a critical look at the current or “as is” state of your organization. As you review your current state, you build out your assurance map with your findings. You can’t really do one without the other. The map, then, will reveal any overlaps and gaps, and provide insight into the resources, time, and costs you might require during your implementation. Looking at an assurance map example will give you a better idea of what we’re talking about. The Institute of Chartered Accountants of England and Wales (ICAEW) has an excellent template.

Galv4

The ICAEW has also provided a guide to building a sound assurance map. The institute suggests you take the following steps:

  1. Identify your sponsor (the main user/senior staff member who will act as a champion).
  2. Determine your scope (identify elements that need assurance, like operational/ business processes, board-level risks, governance, and compliance).
  3. Assess the required amount of assurance for each element (understand what the required or desired amount of assurance is across aspects of the organization).
  4. Identify and list your assurance providers in each line of defense (e.g., audit committee or risk committee in the third line).
  5. Identify your assurance activities (compile and review relevant documentation, select and interview area leads, collate and assess assurance provider information).
  6. Reassess your scope (revisit and update your map scope, based on the information you have gathered/evaluated to date).
  7. Assess the quality of your assurance activities (look at breadth and depth of scope, assurance provider competence, how often activities are reviewed, and the strengths/quality of assurance delivered by each line of defense).
  8. Assess the aggregate actual amount of assurance for each element (the total amount of assurance needs to be assessed, collating all the assurance being provided by each line of defense).
  9. Identify the gaps and overlaps in assurance for each element (compare the actual amount of assurance with the desired amount to determine if there are gaps or overlaps).
  10. Determine your course of action (make recommendations for the actions to be taken/activities to be performed moving forward).

Just based on the steps above, you could understand how your desired state evolves by the time you reach step 10. Ideally, by this point, gaps and overlaps have been eliminated. But the steps we just reviewed don’t cover the frequency of each review and they don’t determine costs. So we’ve decided to add a few more steps to round it out:

  1. Assess the frequency of each assurance activity.
  2. Identify total cost for all the assurance activities in the current state.
  3. Identify the total cost for combined assurance (i.e., when gaps and overlaps have been addressed, and any consequent benefits or cost savings).

DEFINE THE RISKS OF IMPLEMENTATION

Implementing combined assurance is a project, and like any project, there’s a chance it can go sideways and fail, losing you both time and money. So, just like anything else in business, you need to take a risk-based approach. As part of this stage, you’ll want to clearly define the risks of implementing a combined assurance program, and add these risks, along with a mitigation plan and the expected benefits, to your tool kit. As long as the projected benefits of the project outweigh the residual risks and costs, the implementation program is worth pursuing. You’ll need to be able to demonstrate that a little further down the process.

DEFINE RESOURCES & DELIVERABLES

Whoever will own the project of implementing combined assurance will no doubt need dedicated resources in order to execute. So, who do we bring in? On first thought, the internal audit team looks best suited to drive the program forward. But, during the implementation phase, you’ll actually want a cross-functional team of people from internal control, risk, and IT, to work alongside internal audit. So, when you’re considering resourcing, think about each and every team this project touches. Now you know who’s going to do the work, you’ll want to define what they’re doing (key milestones) and when it will be delivered (time frame). And finally, define the actual benefits, as well as the tangible deliverables/outcomes of implementing combined assurance. (The table below provides some examples, but each organization will be unique.)

Galv1

RAISE AWARENESS & GET MANAGEMENT COMMITMENT

Congratulations! You’re now armed with a fancy color-coded impact assessment, and a full list of risks, resources, and deliverables. The next step is to clearly communicate and share the driving factors behind your combined assurance initiative. If you want them to support and champion your efforts, top management will need to be able to quickly take in and understand the rationale behind your desire for combined assurance. Critical output: You’ll want to create a presentation kit of sorts, including the assurance map, lists of risks, resources, and deliverables, a cost/benefit analysis, and any supporting research or frameworks (e.g., the King IV Report, FRC Corporate Governance Code, available industry analysis, and case studies). Chances are, you’ll be presenting this concept more than once, so if you can gather and organize everything in a single spot, that will save a lot of headaches down the track.

ASSIGN ACCOUNTABILITY

When we ask the question, “Who owns the implementation of combined assurance?”, we need to consider two main things:

  • Who would be most impacted if combined assurance were implemented?
  • Who would be senior enough to work across teams to actually get the job done?

It’s evident that a board/C-level executive should lead the project. This project will be spanning multiple departments and require buy-in from many people—so you need someone who can influence and convince. Therefore, we feel that the chief audit executive (CAE) and/or the chief revenue officer (CRO) should be accountable for implementing combined assurance. The CAE literally stands at the intersection of internal and external assurance. Where reliance is placed on the work of others, the CAE is still accountable and responsible for ensuring adequate support for conclusions and opinions reached by the internal audit activity. And the CRO is taking a more active interest in assurance maps as they become increasingly more risk-focused. The Institute of Internal Auditors (IIA), Standard 2050, also assigns accountability to the CAE, stating: “The chief audit executive should share information and coordinate activities with other internal and external assurance providers and consulting services to ensure proper coverage and minimize duplication of effort.” So, not only is the CAE at the intersection of assurance, they’re also directing traffic—exactly the combination we need to drive implementation.

Envisioning the solution

You’ve summarized the current/“as is” state in your assurance map. Now it’s time to move into a future state of mind and envision your desired state. What does your combined assurance solution look like? And, more critically, how will you create it? This stage involves more assessment work. Only now you’ll be digging into the maturity levels of your organization’s risk management and internal audit process, as well as the capabilities and maturity of your Three Lines of Defense. This is where you answer the questions, “What do I want?”, and “Is it even feasible?” Some make-or-break capability factors for implementing combined assurance include:

  1. Corporate risk culture Risk culture and risk appetite shape an organization’s decision-making, and that culture is reflected at every level. Organizations who are more risk-averse tend to be unwilling to make quick decisions without evidence and data. On the other hand, risk-tolerant organizations take more risks, make rapid decisions, and pivot quickly, often without performing due diligence. How will your risk culture shape your combined assurance program?
  2. Risk management awareness If employees don’t know—and don’t prioritize— how risk can and should be managed in your organization, your implementation program will fail. Assurance is very closely tied to risk, so it’s important to communicate constantly and make people aware that risk at every level must be adequately managed.
  3. Risk management processes We just stated that risk and assurance are tightly coupled, so it makes sense that the more mature your risk management processes are, the easier it will be to implement combined assurance. Mature risk management means you’ve got processes defined, documented, running, and refined. For the lucky few who have all of these things, you’re going to have a much easier time compared to those who don’t.
  4. Risk & controls taxonomy Without question, you will require a common risk and compliance language. We can’t have people making up names for tools, referring to processes in different ways, or worst of all, reporting on totally random KPIs. The result of combined assurance should be “one language, one voice, one view” of the risks and issues across the organization.
  5. System & process integrations An integrated system where there is one set of risks and one set of controls is key to delivering effective combined assurance. This includes: Risk registers across the organization, Controls across the organization Issues and audit findings, Reporting.
  6. Technology use Without dedicated software technology, it’s extremely difficult to provide a sustainable risk management system with sound processes, a single taxonomy, and integrated risks and controls. How technology is used in your organization will determine the sustainability of combined assurance. (If you already have a risk management and controls platform that has these integration capabilities, implementation will be easier.)
  7. Using assurance maps as monitoring tools Assurance maps aren’t just for envisioning end-states; they’re also critical monitoring tools that can feed data into your dashboard. They can inform your combined assurance dashboard, to help report on progress.
  8. Continuous improvement mechanisms A mature program will always have improvement mechanisms and feedback loops to incorporate user and stakeholder feedback. A lack of this feedback mechanism will impact the continued effectiveness of combined assurance.

We now assess the maturity of these factors (plus any others that you find relevant) and rank them on a scale of 1-4:

  • Level 1: Not achieved (0-15% of target).
  • Level 2: Partially achieved (15-50%).
  • Level 3: Largely achieved (50-85%).
  • Level 4: Achieved (85-100%).

This rating scale is based on the ISO/IEC 15504 that assigns a rating to the degree each objective (process capability) is achieved. An example of a combined assurance capability maturity assessment can be seen in Figure 2.

Galv2

GAP ANALYSIS

Once the desired levels for all of the factors are agreed on and endorsed by senior management, the next step is to undertake a gap analysis. The example in Figure 2 shows that the current overall maturity level is a 2 and the desired level is a 3 or 4 for each factor. The gap for each factor needs to be analyzed for the activities and resources required to bridge it. Then you can envision the solution and create a roadmap to bridge the gap(s).

SOLUTION VISION & ROADMAP

An example solution vision and roadmap could be:

  • We will use the same terminology and language for risk in all parts of the organization, and establish a single risk dictionary as a central repository.
  • All risks will be categorized according to severity and criticality and be mapped to assurance providers to ensure that no risk is assessed by more than one provider.
  • A rolling assurance plan will be prepared to ensure that risks are appropriately prioritized and reviewed at least once every two years.
  • An integrated, real-time report will be available on demand to show the status, frequency, and coverage of assurance activities.
  • The integrated report/assurance map will be shared with the board, audit committee, and risk committee regularly (e.g., quarterly or half-yearly).
  • To enable these capabilities, risk capture, storage, and reporting will be automated using an integrated software platform.

Figure 3 shows an example roadmap to achieve your desired maturity level.

Galv3

Click here to access Galvanize’s Risk Manangement White Paper


Benchmarking digital risk factors facing financial service firms

Risk management is the foundation upon which financial institutions are built. Recognizing risk in all its forms—measuring it, managing it, mitigating it—are all critical to success. But has every firm achieved that goal? It doesn’t take indepth research beyond the myriad of breach headlines to answer that question.

But many important questions remain: What are key dimensions of the financial sector Internet risk surface? How does that surface compare to other sectors? Which specific industries within Financial Services appear to be managing that risk better than others? We take up these questions and more in this report.

  1. The financial sector boasts the lowest rate of high and critical security exposures among all sectors. This indicates they’re doing a good job managing risk overall.
  2. But not all types of financial service firms appear to be managing risk equally well. For example, the rate of severe findings in the smallest commercial banks is 4x higher than that of the largest banks.
  3. It’s not just small community banks struggling, however. Securities and Commodities firms show a disconcerting combination of having the largest deployment of high-value assets AND the highest rate of critical security exposures.
  4. Others appear to be exceeding the norm. Take credit card issuers: they typically have the largest Internet footprint but balance that by maintaining the lowest rate of security exposures.
  5. Many other challenges and risk factors exist. For instance, the industry average rate of severe security findings in critical cloud-based assets is 3.5x that of assets hosted on-premises.

Dimensions of the Financial Sector Risk Surface

As Digital Transformation ushers in a plethora of changes, critical areas of risk exposure are also changing and expanding. We view the risk surface as anywhere an organization’s ability to operate, reputation, assets, legal obligations, or regulatory compliance is at risk. The aspects of a firm’s risk exposure that are associated with or observable from the internet are considered its internet risk surface. In Figure 1, we compare five key dimensions of the internet risk surface across different industries and highlight where the financial sector ranks among them.

  • Hosts: Number of internet-facing assets associated with an organization.
  • Providers: Number of external service providers used across hosts.
  • Geography: Measure of the geographic distribution of a firm’s hosts.
  • Asset Value: Rating of the data sensitivity and business criticality of hosts based on multiple observed indicators. High value systems that include those that collect GDPR and CCPA regulated information.
  • Findings: Security-relevant issues that expose hosts to various threats, following the CVSS rating scale.

TR1

The values recorded in Figure 1 for these dimensions represent what’s “typical” (as measured by the mean or median) among organizations within each sector. There’s a huge amount of variation, meaning not all financial institutions operate more external hosts than all realtors, but what you see here is the general pattern. The blue highlights trace the ranking of Finance along each dimension.

Financial firms are undoubtedly aware of these tendencies and the need to protect those valuable assets. What’s more, that awareness appears to translate fairly effectively into action. Finance boasts the lowest rate of high and critical security exposures among all sectors. We also ran the numbers specific to high-value assets, and financial institutions show the lowest exposure rates there too. All of this aligns pretty well with expectations—financial firms keep a tight rein on their valuable Internet-exposed assets.

This control tendency becomes even more apparent when examining the distribution of hosts with severe findings in Figure 2. Blue dots mark the average exposure rate for the entire sector (and correspond to values in Figure 1), while the grey bars indicate the amount of variation among individual organizations within each sector. The fact that Finance exhibits the least variation shows that even rotten apples don’t fall as far from the Finance tree as they often do in other sectors. Perhaps a rising tide lifts all boats?

TR2

Security Exposures in Financial Cloud Deployments

We now know financial institutions do well minimizing security findings, but does that record stand equally strong across all infrastructure? Figure 3 answers that question by featuring four of the five key risk surface dimensions:

  • the proportion of hosts (square size),
  • asset value (columns),
  • hosting location (rows),
  • and the rate of severe security findings (color scale and value label).

This view facilitates a range of comparisons, including the relative proportion of assets hosted internally vs. in the cloud, how asset value distributes across hosting locales, and where high-severity issues accumulate.

TR3

From Figure 3, box sizes indicate that organizations in the financial sector host a majority of their Internet-facing systems on-premises, but do leverage the cloud to a greater degree for low-value assets. The bright red box makes it apparent that security exposures concentrate more acutely in high-value assets hosted in the cloud. Overall, the rate of severe findings in cloud-based assets is 3.5x that of on-prem. This suggests the angst many financial firms have over moving to the cloud does indeed have some merit. But when we examine the Finance sector relative to others in Figure 4 the intensity of exposures in critical cloud assets appears much less drastic.

In Figure 3, we can see that the largest number of hosts are on-prem and of medium value. But high-value assets in the cloud exhibit the highest rate of findings.

Given that cloud vs. on-prem exposure disparity, we feel the need to caution against jumping to conclusions. We could interpret these results to proclaim that the cloud isn’t ready for financial applications and should be avoided. Another interpretation could suggest that it’s more about organizational readiness for the cloud than the inherent insecurity of the cloud. Either way, it appears that many financial institutions migrating to the cloud are handling that paradigm shift better than others.

It must also be noted that not all cloud environments are the same. Our Cloud Risk Surface report discovered an average 12X difference between cloud providers with the highest and lowest exposure rates. We still believe this says more about the typical users and use cases of the various cloud platforms than any intrinsic security inequalities. But at the same time, we recommend evaluating cloud providers based on internal features as well as tools and guidance they make available to assist customers in securing their environments. Certain clouds are undoubtedly a better match for financial services use cases while others less so.

TR4

Risk Surface of Subsectors within Financial Services

Having compared Finance to other sectors at a high level, we now examine the risk surface of major subsectors of financial services according to the following NAICS designations:

  • Insurance Carriers: Institutions engaged in underwriting and selling annuities, insurance policies, and benefits.
  • Credit Intermediation: Includes banks, savings institutions, credit card issuers, loan brokers, and processors, etc.
  • Securities & Commodities: Investment banks, brokerages, securities exchanges, portfolio management, etc.
  • Central Banks: Monetary authorities that issue currency, manage national money supply and reserves, etc.
  • Funds & Trusts: Funds and programs that pool securities or other assets on behalf of shareholders or beneficiaries.

TR5

Figure 5 compares these Finance subsectors along the same dimensions used in Figure 1. At the top, we see that Insurance Carriers generally maintain a large Internet surface area (hosts, providers, countries), but a comparatively lower ranking for asset value and security findings. The Credit Intermediation subsector (the NAICS designation that includes banks, brokers, creditors, and processors) follows a similar pattern. This indicates that such organizations are, by and large, able to maintain some level of control over their expanding risk surface.

A leading percentage of high-value assets and a leading percentage of highly critical security findings for the Securities and Commodities subsector is a disconcerting combination. It suggests either unusually high risk tolerance or ineffective risk management (or both), leaving those valuable assets overexposed. The Funds and Trusts subsector exhibits a more riskaverse approach to minimizing exposures across its relatively small digital footprint of valuable assets.

Risk Surface across Banking Institutions

Given that the financial sector is so broad, we thought a closer examination of the risk surface particular to banking institutions was in order. Banks have long concerned themselves with risk. Well before the rise of the Internet or mobile technologies, banks made their profits by determining how to gauge the risk of potential borrowers or loans, plotting the risk and reward of offering various deposit and investment products, or entering different markets, allowing access through several delivery channels. It could be said that the successful management and measurement of risk throughout an organization is perhaps the key factor that has always determined the relative success or failure of any bank.

As a highly-regulated industry in most countries, banking institutions must also consider risk from more than a business or operational perspective. They must take into account the compliance requirements to limit risk in various areas, and ensure that they are properly securing their systems and services in a way that meets regulatory standards. Such pressures undoubtedly affect the risk surface and Figure 6 hints at those effects on different types of banking institutions.

Credit card issuers earn the honored distinction of having the largest average number of Internet-facing hosts (by far) while achieving the lowest prevalence of severe security findings. Credit unions flip this trend with the fewest hosts and most prevalent findings. This likely reflects the perennial struggle of credit unions to get the most bang from their buck.

Traditionally well-resourced commercial banks leverage the most third party providers and have a presence in more countries, all with a better-than-average exposure rate. Our previous research revealed that commercial banks were among the top two generators and receivers of multi-party cyber incidents, possibly due to the size and spread of their risk surface.

TR6

Two Things to Consider

  1. In this interconnected world, third-party and fourth-party risk is your risk. If you are a financial institution, particularly a commercial bank, take a moment to congratulate yourself on managing risk well – but only for a moment. Why? Because every enterprise is critically dependent on a wide array of vendors and partners that span a broad spectrum of industries. Their risk is your risk. The work of your third-party risk team is critically important in holding your vendors accountable to managing your risk interests well.
  2. Managing risk—whether internal or third-party—requires focus. There are simply too many things to do, giving rise to the endless “hamster wheel of risk management.” A better approach starts with obtaining an accurate picture of your risk surface and the critical exposures across it. This includes third-party relationships, and now fourth-party risk, which bank regulators are now requiring. Do you have the resources to sufficiently manage this? Do you know your risk surface?

Click here to access Riskrecon Cyentia’s Study

Uncertainty Visualization

Uncertainty is inherent to most data and can enter the analysis pipeline during the measurement, modeling, and forecasting phases. Effectively communicating uncertainty is necessary for establishing scientific transparency. Further, people commonly assume that there is uncertainty in data analysis, and they need to know the nature of the uncertainty to make informed decisions.

However, understanding even the most conventional communications of uncertainty is highly challenging for novices and experts alike, which is due in part to the abstract nature of probability and ineffective communication techniques. Reasoning with uncertainty is unilaterally difficult, but researchers are revealing how some types of visualizations can improve decision-making in a variety of diverse contexts,

  • from hazard forecasting,
  • to healthcare communication,
  • to everyday decisions about transit.

Scholars have distinguished different types of uncertainty, including

  • aleatoric (irreducible randomness inherent in a process),
  • epistemic (uncertainty from a lack of knowledge that could theoretically be reduced given more information),
  • and ontological uncertainty (uncertainty about how accurately the modeling describes reality, which can only be described subjectively).

The term risk is also used in some decision-making fields to refer to quantified forms of aleatoric and epistemic uncertainty, whereas uncertainty is reserved for potential error or bias that remains unquantified. Here we use the term uncertainty to refer to quantified uncertainty that can be visualized, most commonly a probability distribution. This article begins with a brief overview of the common uncertainty visualization techniques and then elaborates on the cognitive theories that describe how the approaches influence judgments. The goal is to provide readers with the necessary theoretical infrastructure to critically evaluate the various visualization techniques in the context of their own audience and design constraints. Importantly, there is no one-size-fits-all uncertainty visualization approach guaranteed to improve decisions in all domains, nor even guarantees that presenting uncertainty to readers will necessarily improve judgments or trust. Therefore, visualization designers must think carefully about each of their design choices or risk adding more confusion to an already difficult decision process.

Uncertainty Visualization Design Space

There are two broad categories of uncertainty visualization techniques. The first are graphical annotations that can be used to show properties of a distribution, such as the mean, confidence/credible intervals, and distributional moments.

Numerous visualization techniques use the composition of marks (i.e., geometric primitives, such as dots, lines, and icons) to display uncertainty directly, as in error bars depicting confidence or credible intervals. Other approaches use marks to display uncertainty implicitly as an inherent property of the visualization. For example, hypothetical outcome plots (HOPs) are random draws from a distribution that are presented in an animated sequence, allowing viewers to form an intuitive impression of the uncertainty as they watch.

The second category of techniques focuses on mapping probability or confidence to a visual encoding channel. Visual encoding channels define the appearance of marks using controls such as color, position, and transparency. Techniques that use encoding channels have the added benefit of adjusting a mark that is already in use, such as making a mark more transparent if the uncertainty is high. Marks and encodings that both communicate uncertainty can be combined to create hybrid approaches, such as in contour box plots and probability density and interval plots.

More expressive visualizations provide a fuller picture of the data by depicting more properties, such as the nature of the distribution and outliers, which can be lost with intervals. Other work proposes that showing distributional information in a frequency format (e.g., 1 out of 10 rather than 10%) more naturally matches how people think about uncertainty and can improve performance.

Visualizations that represent frequencies tend to be highly effective communication tools, particularly for individuals with low numeracy (e.g., inability to work with numbers), and can help people overcome various decision-making biases.

Researchers have dedicated a significant amount of work to examining which visual encodings are most appropriate for communicating uncertainty, notably in geographic information systems and cartography. One goal of these approaches is to evoke a sensation of uncertainty, for example, using fuzziness, fogginess, or blur.

Other work that examines uncertainty encodings also seeks to make looking-up values more difficult when the uncertainty is high, such as value-suppressing color pallets.

Given that there is no one-size-fits-all technique, in the following sections, we detail the emerging cognitive theories that describe how and why each visualization technique functions.

VU1

Uncertainty Visualization Theories

The empirical evaluation of uncertainty visualizations is challenging. Many user experience goals (e.g., memorability, engagement, and enjoyment) and performance metrics (e.g., speed, accuracy, and cognitive load) can be considered when evaluating uncertainty visualizations. Beyond identifying the metrics of evaluation, even the most simple tasks have countless configurations. As a result, it is hard for any single study to sufficiently test the effects of a visualization to ensure that it is appropriate to use in all cases. Visualization guidelines based on a single or small set of studies are potentially incomplete. Theories can help bridge the gap between visualizations studies by identifying and synthesizing converging evidence, with the goal of helping scientists make predictions about how a visualization will be used. Understanding foundational theoretical frameworks will empower designers to think critically about the design constraints in their work and generate optimal solutions for their unique applications. The theories detailed in the next sections are only those that have mounting support from numerous evidence-based studies in various contexts. As an overview, The table provides a summary of the dominant theories in uncertainty visualization, along with proposed visualization techniques.

UV2

General Discussion

There are no one-size-fits-all uncertainty visualization approaches, which is why visualization designers must think carefully about each of their design choices or risk adding more confusion to an already difficult decision process. This article overviews many of the common uncertainty visualization techniques and the cognitive theory that describes how and why they function, to help designers think critically about their design choices. We focused on the uncertainty visualization methods and cognitive theories that have received the most support from converging measures (e.g., the practice of testing hypotheses in multiple ways), but there are many approaches not covered in this article that will likely prove to be exceptional visualization techniques in the future.

There is no single visualization technique we endorse, but there are some that should be critically considered before employing them. Intervals, such as error bars and the Cone of Uncertainty, can be particularly challenging for viewers. If a designer needs to show an interval, we also recommend displaying information that is more representative, such as a scatterplot, violin plot, gradient plot, ensemble plot, quantile dotplot, or HOP. Just showing an interval alone could lead people to conceptualize the data as categorical. As alluded to in the prior paragraph, combining various uncertainty visualization approaches may be a way to overcome issues with one technique or get the best of both worlds. For example, each animated draw in a hypothetical outcome plot could leave a trace that slowly builds into a static display such as a gradient plot, or animated draws could be used to help explain the creation of a static technique such as a density plot, error bar, or quantile dotplot. Media outlets such as the New York Times have presented animated dots in a simulation to show inequalities in wealth distribution due to race. More research is needed to understand if and how various uncertainty visualization techniques function together. It is possible that combining techniques is useful in some cases, but new and undocumented issues may arise when approaches are combined.

In closing, we stress the importance of empirically testing each uncertainty visualization approach. As noted in numerous papers, the way that people reason with uncertainty is non-intuitive, which can be exacerbated when uncertainty information is communicated visually. Evaluating uncertainty visualizations can also be challenging, but it is necessary to ensure that people correctly interpret a display. A recent survey of uncertainty visualization evaluations offers practical guidance on how to test uncertainty visualization techniques.

Click her to access the entire article in Handbook of Computational Statistics and Data Science

Overview on EIOPA Consultation Paper on the Opinion on the 2020 review of Solvency II

The Solvency II Directive provides that certain areas of the framework should be reviewed by the European Commission at the latest by 1 January 2021, namely:

  • long-term guarantees measures and measures on equity risk,
  • methods, assumptions and standard parameters used when calculating the Solvency Capital Requirement standard formula,
  • Member States’ rules and supervisory authorities’ practices regarding the calculation of the Minimum Capital Requirement,
  • group supervision and capital management within a group of insurance or reinsurance undertakings.

Against that background, the European Commission issued a request to EIOPA for technical advice on the review of the Solvency II Directive in February 2019 (call for advice – CfA). The CfA covers 19 topics. In addition to topics that fall under the four areas mentioned above, the following topics are included:

  • transitional measures
  • risk margin
  • Capital Markets Union aspects
  • macroprudential issues
  • recovery and resolution
  • insurance guarantee schemes
  • freedom to provide services and freedom of establishment
  • reporting and disclosure
  • proportionality and thresholds
  • best estimate
  • own funds at solo level

EIOPA is requested to provide technical advice by 30 June 2020.

Executive summary

This consultation paper sets out technical advice for the review of Solvency II Directive. The advice is given in response to a call for advice from the European Commission. EIOPA will provide its final advice in June 2020. The call for advice comprises 19 separate topics. Broadly speaking, these can be divided into three parts.

  1. Firstly, the review of the long term guarantee measures. These measures were always foreseen as being reviewed in 2020, as specified in the Omnibus II Directive. A number of different options are being consulted on, notably on extrapolation and on the volatility adjustment.
  2. Secondly, the potential introduction of new regulatory tools in the Solvency II Directive, notably on macro-prudential issues, recovery and resolution, and insurance guarantee schemes. These new regulatory tools are considered thoroughly in the consultation.
  3. Thirdly, revisions to the existing Solvency II framework including in relation to
    • freedom of services and establishment;
    • reporting and disclosure;
    • and the solvency capital requirement.

Given that the view of EIOPA is that overall the Solvency II framework is working well, the approach here has in general been one of evolution rather than revolution. The principal exceptions arise as a result either of supervisory experience, for example in relation to cross-border business; or of the wider economic context, in particular in relation to interest rate risk. The main specific considerations and proposals of this consultation paper are as follows:

  • Considerations to choose a later starting point for the extrapolation of risk-free interest rates for the euro or to change the extrapolation method to take into account market information beyond the starting point.
  • Considerations to change the calculation of the volatility adjustment to risk-free interest rates, in particular to address overshooting effects and to reflect the illiquidity of insurance liabilities.
  • The proposal to increase the calibration of the interest rate risk submodule in line with empirical evidence. The proposal is consistent with the technical advice EIOPA provided on the Solvency Capital Requirement standard formula in 2018.
  • The proposal to include macro-prudential tools in the Solvency II Directive.
  • The proposal to establish a minimum harmonised and comprehensive recovery and resolution framework for insurance.

A background document to this consultation paper includes a qualitative assessment of the combined impact of all proposed changes. EIOPA will collect data in order to assess the quantitative combined impact and to take it into account in the decision on the proposals to be included in the advice. Beyond the changes on interest rate risk EIOPA aims in general for a balanced impact of the proposals.

The following paragraphs summarise the main content of the consulted advice per chapter.

Long-term guarantees measures and measures on equity risk

EIOPA considers to choose a later starting point for the extrapolation of risk-free interest rates for the euro or to change the extrapolation method to take into account market information beyond the starting point. Changes are considered with the aim to avoid the underestimation of technical provisions and wrong risk management incentives. The impact on the stability of solvency positions and the financial stability is taken into account. The paper sets out two approaches to calculate the volatility adjustment to the risk-free interest rates. Both approaches include application ratios to mitigate overshooting effects of the volatility adjustment and to take into account the illiquidity characteristics of the insurance liabilities the adjustment is applied to.

  • One approach also establishes a clearer split between a permanent component of the adjustment and a macroeconomic component that only exists in times of wide spreads.

EIOPA2

  • The other approach takes into account the undertakings-specific investment allocation to further address overshooting effects.

EIOPA3

Regarding the matching adjustment to risk-free interest rates the proposal is made to recognise in the Solvency Capital Requirement standard formula diversification effects with regard to matching adjustment portfolios. The advice includes proposals to strengthen the public disclosure on the long term guarantees measures and the risk management provisions for those measures.

EIOPA1

The advice includes a review of the capital requirements for equity risk and proposals on the criteria for strategic equity investments and the calculation of long-term equity investments. Because of the introduction of the capital requirement on long-term equity investments EIOPA intends to advise that the duration-based equity risk sub-module is phased out.

Technical provisions

EIOPA identified a larger number of aspects in the calculation of the best estimate of technical provisions where divergent practices among undertakings or supervisors exist. For some of these issues, where EIOPA’s convergence tools cannot ensure consistent practices, the advice sets out proposals to clarify the legal framework, mainly on

  • contract boundaries,
  • the definition of expected profits in future premiums
  • and the expense assumptions for insurance undertakings that have discontinued one product type or even their whole business.

With regard to the risk margin of technical provisions transfer values of insurance liabilities, the sensitivity of the risk margin to interest rate changes and the calculation of the risk margin for undertakings that apply the matching adjustment or the volatility adjustment were analysed. The analysis did not result in a proposal to change the calculation of the risk margin.

Own funds

EIOPA has reviewed the differences in tiering and limits approaches within the insurance and banking framework, utilising quantitative and qualitative assessment. EIOPA has found that they are justifiable in view of the differences in the business of both sectors.

EIOPA4

Solvency Capital Requirement standard formula

EIOPA confirms its advice provided in 2018 to increase the calibration of the interest rate risk sub-module. The current calibration underestimates the risk and does not take into account the possibility of a steep fall of interest rate as experienced during the past years and the existence of negative interest rates. The review

  • of the spread risk sub-module,
  • of the correlation matrices for market risks,
  • the treatment of non-proportional reinsurance,
  • and the use of external ratings

did not result in proposals for change.

Minimum Capital Requirement

Regarding the calculation of the Minimum Capital Requirement it is suggested to update the risk factors for non-life insurance risks in line with recent changes made to the risk factors for the Solvency Capital Requirement standard formula. Furthermore, proposals are made to clarify the legal provisions on noncompliance with the Minimum Capital Requirement.

EIOPA5

Reporting and disclosure

The advice proposes changes to the frequency of the Regular Supervisory Report to supervisors in order to ensure that the reporting is proportionate and supports risk-based supervision. Suggestions are made to streamline and clarify the expected content of the Regular Supervisory Report with the aim to support insurance undertakings in fulfilling their reporting task avoiding overlaps between different reporting requirements and to ensure a level playing field. Some reporting items are proposed for deletion because the information is also available through other sources. The advice includes a review of the reporting templates for insurance groups that takes into account earlier EIOPA proposals on the templates of solo undertakings and group specificities.

EIOPA proposes an auditing requirement for balance sheet at group level in order to improve the reliability and comparability of the disclosed information. It is also suggested to delete the requirement to translate the summary of that report.

Proportionality

EIOPA has reviewed the rules for exempting insurance undertakings from the Solvency II Directive, in particular the thresholds on the size of insurance business. As a result, EIOPA proposes to maintain the general approach to exemptions but to reinforce proportionality across the three pillars of the Solvency II Directive.

Regarding thresholds EIOPA proposes to double the thresholds related to technical provisions and to allow Member States to increase the current threshold for premium income from the current amount of EUR 5 million to up to EUR 25 million.

EIOPA had reviewed the simplified calculation of the standard formula and proposed improvements in 2018. In addition to that the advice includes proposals to simplify the calculation of the counterparty default risk module and for simplified approaches to immaterial risks. Proposals are made to improve the proportionality of the governance requirements for insurance and reinsurance undertakings, in particular on

  • key functions (cumulation with operational functions, cumulation of key functions other than the internal audit, cumulation of key and AMSB function)
  • own risk and solvency assessment (ORSA) (biennial report),
  • written policies (review at least once every three years)
  • and administrative, management and supervisory bodies (AMSB) ( evaluation shall include an assessment on the adequacy of the composition, effectiveness and internal governance of the administrative, management or supervisory body taking into account the nature, scale and complexity of the risks inherent in the undertaking’s business)

Proposals to improve the proportionality in reporting and disclosure of Solvency II framework were made by EIOPA in a separate consultation in July 2019.

Group supervision

EIOPA proposes a number of regulatory changes to address the current legal uncertainties regarding supervision of insurance groups under the Solvency II Directive. This is a welcomed opportunity as the regulatory framework for groups was not very specific in many cases while in others it relies on the mutatis mutandis application of solo rules without much clarifications.

In particular, there are policy proposals to ensure that the

  • definitions applicable to groups,
  • scope of application of group supervision
  • and supervision of intragroup transactions, including issues with third countries

are consistent.

Other proposals focus on the rules governing the calculation of group solvency, including own funds requirements as well as any interaction with the Financial Conglomerates Directive. The last section of the advice focuses on the uncertainties related to the application of governance requirements at group level.

Freedom to provide services and freedom of establishment

EIOPA further provides suggestions in relation to cross border business, in particular to support efficient exchange of information among national supervisory authorities during the process of authorising insurance undertakings and in case of material changes in cross-border activities. It is further recommended to enhance EIOPA’s role in the cooperation platforms that support the supervision of cross-border business.

Macro-prudential policy

EIOPA proposes to include the macroprudential perspective in the Solvency II Directive. Based on previous work, the advice develops a conceptual approach to systemic risk in insurance and then analyses the current existing tools in the Solvency II framework against the sources of systemic risk identified, concluding that there is the need for further improvements in the current framework.

EIOPA7

Against this background, EIOPA proposes a comprehensive framework, covering the tools initially considered by the European Commission (improvements in Own Risk and Solvency Assessment and the prudent person principle, as well as the drafting of systemic risk and liquidity risk management plans), as well as other tools that EIOPA considers necessary to equip national supervisory authorities with sufficient powers to address the sources of systemic risk in insurance. Among the latter, EIOPA proposes to grant national supervisory authorities with the power

  • to require a capital surcharge for systemic risk,
  • to define soft concentration thresholds,
  • to require pre-emptive recovery and resolution plans
  • and to impose a temporarily freeze on redemption rights in exceptional circumstances.

EIOPA8

Recovery and resolution

EIOPA calls for a minimum harmonised and comprehensive recovery and resolution framework for (re)insurers to deliver increased policyholder protection and financial stability in the European Union. Harmonisation of the existing frameworks and the definition of a common approach to the fundamental elements of recovery and resolution will avoid the current fragmented landscape and facilitate cross-border cooperation. In the advice, EIOPA focuses on the recovery measures including the request for pre-emptive recovery planning and early intervention measures. Subsequently, the advice covers all relevant aspects around the resolution process, such as

  • the designation of a resolution authority,
  • the resolution objectives,
  • the need for resolution planning
  • and for a wide range of resolution powers to be exercised in a proportionate way.

The last part of the advice is devoted to the triggers for

  • early intervention,
  • entry into recovery and into resolution.

EIOPA9

Other topics of the review

The review of the ongoing appropriateness of the transitional provisions included in the Solvency II Directive did not result in a proposal for changes. With regard to the fit and proper requirements of the Solvency II Directive EIOPA proposes to clarify the position of national supervisory authorities on the ongoing supervision of propriety of board members and that they should have effective powers in case qualifying shareholders are not proper. Further advice is provided in order to increase the efficiency and intensity of propriety assessments in complex cross-border cases by providing the possibility of joint assessment and use of EIOPA’s powers to assist where supervisors cannot reach a common view.

Click here to access EIOPA’s detailed Consultation Paper