Achieving Digital Maturity Adapting Your Company to a Changing World

Adapting to increasingly digital market environments and taking advantage of digital technologies to improve operations are important goals for nearly every contemporary business. Yet, few companies appear to be making the fundamental changes their leaders believe are necessary to achieve these goals.

Based on a global survey of more than 3,500 managers and executives and 15 interviews with executives and thought leaders, MIT Sloan Management Review and Deloitte’s third annual study of digital business reveals five key practices of companies that are developing into more mature digital organizations. Their approaches, which may offer valuable lessons for companies that want to improve their own digital efforts, include:

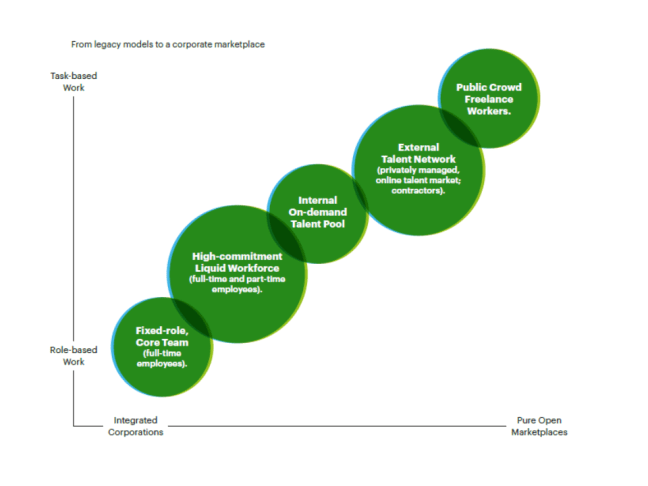
  1. Implementing systemic changes in how they organize and develop workforces, spur workplace innovation, and cultivate digitally minded cultures and experiences. For example, more than 70% of respondents from digitally maturing companies say their organizations are increasingly organized around cross-functional teams versus only 28% of companies at early stages of digital development. We discuss how this fundamental shift in the way work gets done has significant implications for
    • organizational behavior,
    • corporate culture,
    • talent recruitment,
    • and leadership tactics.
  2. Playing the long game. Their strategic planning horizons are consistently longer than those of less digitally mature organizations, with nearly 30% looking out five years or more versus only 13% for the least digitally mature organizations. Their digital strategies focus on both technology and core business capabilities. We discuss how linking digital strategies to the company’s core business and focusing on organizational change and flexibility enables companies to adjust to rapidly changing digital environments.
  3. Scaling small digital experiments into enterprise-wide initiatives that have business impact. At digitally maturing entities, small “i” innovations or experiments typically lead to more big “I” innovations than at other organizations. Digitally maturing organizations are more than twice as likely as companies at the early stages of digital development to drive both small, iterative experiments and enterprise-wide initiatives rather than mainly experiments. Digitally maturing organizations also can be shrewd and disciplined in figuring out how to fund these endeavors and keep them from languishing in the face of more immediate investment needs.
  4. Becoming talent magnets. Employees and executives are highly inclined to jump ship if they feel they don’t have opportunities to develop digital skills. For example, vice president-level executives without sufficient digital opportunities are 15 times more likely to want to leave within a year than are those with satisfying digital challenges. Digitally maturing organizations typically understand the need for and place a premium on attracting and developing digital talent. Their development efforts often go far beyond traditional training. These businesses create compelling environments for achieving career growth ambitions while acquiring digital skills and experience, which make employees want to stay.
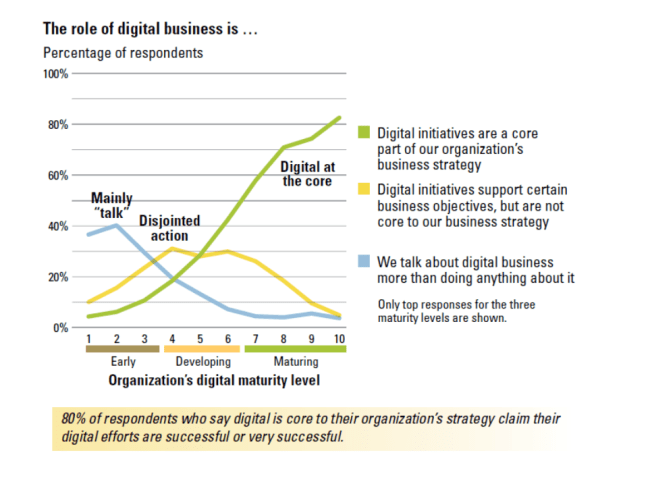
  5. Securing leaders with the vision necessary to lead a digital strategy, and a willingness to commit resources to achieve this vision. These leaders are more likely to have articulated a compelling ambition for what their digital businesses can be and define digital initiatives as core components to achieving their business strategy. A larger percentage of digitally maturing companies are also planning to increase their digital investment compared to their less digitally mature counterparts, which threatens to widen an already large gap in the level of digital success.

DigitalMaturity

Click here to access MIT’s detailed survey report

EIOPA publishes first set of Solvency II statistics on the European insurance sector

Balance sheet structure, main items

Assets

The asset side of the Solvency II balance sheet is split into investments, assets held for unit-linked business and other assets. Investments represent those held by insurers in order to be able to fulfil the promises made to the policy-holder on an on-going basis. This excludes unit-linked business for which the investment risk is assumed by the policyholder. On an EEA wide basis, Figure 1 shows that the investment portfolio of insurers is dominated by bonds. Corporate and government bonds together account for more than 60% of the portfolio.

Figure 1: Investment mix by insurers in EEA following S.02 Balance sheet. 2016 Q3. %

Table 1 EIOPA

However, the investments shown in these figures represent only part of the balance sheet. There is also a considerable share of investments for unit-linked business. Table 1 shows the breakdown of total assets into three main categories (investments as shown above, assets held for unit-linked business and other assets). The share of unit-linked business (measured by assets) in the EEA was 21.9% in Q3-2016.

Table 1: Main categories of total assets by insurers in per country. 2016 Q3. EUR million and %

Tableau 1 EIOPA

Liabilities

Total liabilities consist of technical provisions and other liabilities. This is illustrated on an EEA level in the Figure below. Technical provisions represent the amount of resources to be set aside to pay policy-holder claims and are split into 5 main categories. Other liabilities include debt such as subordinated liabilities and financial liabilities other than debts owed to credit institutions, but also other liabilities such as, for example, deposits from reinsurers.

Figure 2: Liability profile insurers in EEA. 2016-Q3. %

Tableau 2 EIOPA

Premiums (Non-life)

One way of assessing market size is to look at the gross (i.e. before reinsurance) written premiums by country. The Figure below ranks the countries according to the gross premiums written by undertakings in their jurisdiction in the first 3 quarters of 2016. At this stage the figure shows only premiums in the non-life segment, since life premiums are not available for Q3-2016 on a consistent basis. There is an ongoing process to eliminate some national differences in reporting of life premiums.

Figure 3: Non-life GWP (gross written premiums) per country. 2016 Q3 Year to date.
Source: EIOPA [Solo/Quarterly/Published 20170628/Data extracted 20170614]. Excluding undertakings with non-standard financial year-end. Reinsurance premiums not included.

Tableau 3 EIOPA

Own funds and MCR/SCR ratios

Insurance undertakings are required by the Solvency II regulation to hold a certain amount of capital of sufficient quality in addition to the assets they hold to cover the contractual obligations towards policyholders. The amount of capital (called eligible own funds) required is defined by the Minimum Capital Requirement (MCR) and the Solvency Capital Requirement (SCR), which depend on the risks to which the undertaking is exposed.. If the amount of eligible own funds falls below the MCR, the insurance license should be withdrawn if appropriate coverage cannot be re-stablished within a short period of time. Holding enough eligible own funds to cover the SCR enables undertakings to absorb significant losses, even in difficult times. Undertakings’ compliance with the SCR therefore gives reasonable assurance to policyholders that payments will be made as they fall due.

The SCR is calculated either by using a prescribed formula (called the standard formula) or by employing an undertaking-specific partial or full internal model that has been approved by the supervisory authority. Being risk-sensitive the SCR is subject to fluctuations and undertakings are required to monitor it continuously, calculate it at least annually and re-calculate it whenever their overall risk changes significantly.

As non-compliance with the MCR jeopardizes policyholders’ interests, the MCR has to be re-calculated quarterly according to a given formula. The ratios shown in Table 2 are computed by dividing the respective eligible own funds by the SCR and MCR figures as reported by the insurance undertakings at the end of Q3 2016.

Table 2: MCR and SCR ratios by country. Weighted average and interquartile distribution. 2016 Q3

Table 2 EIOPA

Click here to access EIOPA’s Report

What is the Era of the Intelligent Insurer

The biggest innovations in insurance over the next three years will not be in the technology tools themselves, but in how we design them with employees, customers, intermediaries and other human partners in mind.

Digital technology continues to reshape the insurance industry at an unprecedented and quickening pace. In our Technology Vision 2017 research, 87 percent of insurance respondents agreed that we have entered an era of technology advancement that is no longer marked by linear progression, but by an exponential rate of change.

What sets this new wave of disruption apart from those that preceded it is that humans are firmly in control of how technology reshapes our experiences, our industry and the wider world. It’s no longer people who are adapting to technology—rather, the technology is adapting to us.

We’re putting technology to work to disrupt ourselves, our organizations and entire industries. The technology we use today—compared to that of just a few years ago—is increasingly interactive, as touch displays, mixed reality, and natural language processing make it feel more human.

Advanced technology is now capable of learning, with contextual analysis, image recognition and deep learning algorithms that make it seem to think more like us. And, perhaps best of all, technology can now adapt—by constantly aligning itself to our wants and needs.

The five major trends observed are :

  1. AI is the new UI – The Experience Above All
  2. Ecosystem Power Plays – Unleash the Power of Us
  3. Workforce Marketplace – Invent Your Future
  4. Design for Humans – Inspire New Behaviors
  5. The Uncharted – Invent New Industries, Set New Standards

Marketplaces

Click here to access Accenture’s detailed report

The Imperative to Raise Enterprise Risk Intelligence

How to raise enterprise risk intelligence

  • Break down silos and collaborate. To ensure all risks are addressed, finance, operations, compliance, legal and IT functions should work together in managing enterprise risks. According to 53 percent of respondents, there is little, if any, collaboration among these functions to achieve a clearly defined enterprise risk management strategy.
  • Focus on accomplishments that will make a difference. The findings reveal a significant gap between the most important features of a risk intelligence platform and what features are actually accomplished. The features considered most important but rarely accomplished are:
    • Business continuity response (produces plans, runs business impact analyses, resiliency controls and engages stakeholders in crisis drills and recovery)
    • Incident/issue risk response (coordination of classification, collaboration, evidence, policies and reporting across the organization for all operational and security risk events)
    • Operational risk & compliance (creates risk registers and runs Risk and Compliance Self-Assessments (RCSAs) against critical business processes to report key risk indicators (KRIs), findings and loss events)
    • Threat and vulnerability mitigation (automates continuous risk correlation, prioritization and remediation of assets and operation criticality, threat reachability, control and vulnerabilities)
  • Establish a formal budget for enterprise risk management. It is critical to allocate resources specifically designated to achieving a well-executed enterprise risk management program. Fiftyeight percent of respondents say their organizations do not have a formal budget.
  • Engage management and the board of directors in the organization’s risk strategy. The inability to get started was one of the top three barriers to achieving risk management objectives. Senior leadership’s involvement will incentivize and motivate collaboration and a formal process for achieving the objectives of a risk management program.
  • Achieve clarity of your IT assets and infrastructure. A clear map of the infrastructure and categorization of assets, especially high value and knowledge assets, is key to ensuring appropriate risk measures are in place. Only 24 percent of respondents say they have categorized assets based on their business criticality.
  • Assign accountability for the achievement of specific risk management objectives. According to the findings, either no one person has overall responsibility or it is dispersed throughout the organization.
  • Measure effectiveness in risk intelligence efforts. Only 31 percent of respondents say their organizations have specific metrics to determine how well risks are being managed. Many organizations represented in this study are not measuring such key objectives as time to contain threats and attacks, time to identify and pinpoint high-risk areas and time to remediate after containment of the attack.
  • Consolidated risk reporting is essential. Sixty-three percent of respondents say it is essential or very important to have a centralized or consolidated risk reporting (one set of metrics) in order to achieve a strong security posture.
  • Replace complexity with ease of use. The number one barrier to achieving risk management objectives is the complexity of technologies that support risk management objectives. Understandably, the number one feature of a risk management solution is ease of use (53 percent of respondents). Investments in risk management technologies that end up on the shelf because of complexity and the lack of in-house expertise will frustrate any attempts to achieve an enterprise risk management program.

ERM Survey

2017_Report_on_ERM

A Field Guide to Data Science

  • Data Science is the art of turning data into actions.

It’s all about the tradecraft. Tradecraft is the process, tools and technologies for humans and computers to work together to transform data into insights.

  • Data Science tradecraft creates data products.

Data products provide actionable information without exposing decision makers to the underlying data or analytics (e.g., buy/sell strategies for financial instruments, a set of actions to improve product yield, or steps to improve product marketing).

  • Data Science supports and encourages shifting between deductive (hypothesis-based) and inductive (patternbased) reasoning.

This is a fundamental change from traditional analysis approaches. Inductive reasoning and exploratory data analysis provide a means to form or refine hypotheses and discover new analytic paths. Models of reality no longer need to be static. They are constantly tested, updated and improved until better models are found.

  • Data Science is necessary for companies to stay with the pack and compete in the future.

Organizations are constantly making decisions based on gut instinct, loudest voice and best argument – sometimes they are even informed by real information. The winners and the losers in the emerging data economy are going to be determined by their Data Science teams.

  • Data Science capabilities can be built over time.

Organizations mature through a series of stages – Collect, Describe, Discover, Predict, Advise – as they move from data deluge to full Data Science maturity. At each stage, they can tackle increasingly complex analytic goals with a wider breadth of analytic capabilities. However, organizations need not reach maximum Data Science maturity to achieve success. Significant gains can be found in every stage.

  • Data Science is a different kind of team sport.

Data Science teams need a broad view of the organization. Leaders must be key advocates who meet with stakeholders to ferret out the hardest challenges, locate the data, connect disparate parts of the business, and gain widespread buy-in.

Data Science Activities

2015-field-guide-to-data-science-160211215115

What’s now and next in Analytics, AI, and Automation

Over the past few years, rapid technological advances in digitization and data and analytics have been

  • reshaping the business landscape,
  • supercharging performance
  • and enabling the emergence of new business innovations
  • and new forms of competition
  • and business disruption.

Yet progress has been uneven. While many companies struggle to harness the power of these technologies, companies that are fully leveraging the capabilities are capturing disproportionate benefits, transforming their businesses and outpacing—and occasionally disrupting—the rest.

At the same time the technology itself continues to evolve rapidly, bringing new waves of advances in

  • robotics,
  • analytics,
  • and artificial intelligence (AI),
  • and especially machine learning.

Together they amount to a step change in technical capabilities that could have profound implications for business, for the economy, and more broadly for society as a whole. Machines today increasingly match or outperform human performance in a range of work activities, including ones that require cognitive capabilities, learning, making tacit judgments, sensing emotion, and even driving—activities that used to be considered safe from automation. Adoption of these technologies could bring significant new performance and transformational benefits to companies that go beyond simply substituting labor and lead to previously unimagined breakthrough performance and outcomes. Moreover, they have the potential to boost the productivity of the global economy at a time when it is sorely needed for growth and the share of the working-age population is declining.

Yet their advent raises difficult questions about how companies can best prepare for and harness these technologies, the skills and organizational reinvention that will be required to make the most of them, and how the leaders in the private and public sector as well as workers will adapt to the impact on jobs, capability-building and the nature of work itself.

Disruption

MGI-Briefing-Note-Automation-final

InsurTech Caught on the Radar

The overall picture that emerges from our InsurTech Radar is, first of all, that different business model categories vary significantly in terms of overall level of economic attractiveness and degree of startup activity. While some see little startup activity, others already appear overcrowded. The number of InsurTechs active in a category is not always in line with its relative attractiveness.

Secondly, even in the most attractive business model categories, it is not clear that InsurTechs will disrupt the industry and make the race. The players most likely to succeed vary by category. InsurTechs will not always be the winners. There are several categories in which either incumbents embracing digital change or firms from outside the insurance industry are most likely to succeed.

Thirdly, a number of underdeveloped categories present attractive opportunities. To be successful in these areas will require innovators to get creative on “demand side” thinking creating models that fundamentally change how risk coverage is presented and sold to customers, models that are not merely digital updates of traditional or slightly altered insurance propositions. Such thinking – substantially different from the “supply side” models of the current, first wave of InsurTechs – is essential for uncovering latent customer demand for risk cover.

Segment 1: Proposition

The proposition segment is less than half the size of the others. It is also the most varied in terms of outlook. The InsurTech Radar shows that there is currently a major mismatch in this segment between the categories with the highest level of startup activity and those with the greatest overall potential. Examples include Situational and Community-Based business model categories which we see as over-emphasized. Nevertheless, the proposition segment includes some of the most attractive categories of any InsurTech segment, as they represent true innovation on how risk coverage is presented and sold to customers – some of these currently see relatively little activity so far (such as the Risk Partner business model category). While the news here is good for established insurers, in that they are likely to be the winners in several of these attractive categories, it is also quite clear that InsurTechs are here to stay. The emergence of newly funded and fully digital insurance carriers might bring forward real breakthroughs. It is very likely that the segment will look quite different in a few years.

Segment 2: Distribution

The InsurTech Radar shows the distribution segment to be much better matched in terms of the level of activity and the categories with the highest likelihood of success. On the down side, all but two of these areas have, comparatively only moderate potential at best, due either to limited premium pools, challenges in sustaining value generation, little opportunity for differentiation, or some combination of these (such as B2C Online Brokers). As in the proposition segment, some of the most crowded categories are also likely to see a shakeout.

Segment 3: Operations

The operations segment is the most consistent of the three: Only one business model category here currently shows limited potential (the “Balance Sheet / Financial Resource
Management” category). Most others are highly attractive. InsurTechs are likely to dominate the segment, albeit sharing honors in the underwriting category with reinsurers.

InsurTech OW

Oliver_Wyman_and_Policen_Direkt_Global_InsurTech_Report_2017

How to successfully mitigate your organization’s third-party risk

What Is Third-Party Risk Management & Third-Party Due Diligence?

Third-party risk management is the process of assessing and controlling reputational, financial and legal risks to your organization posed by parties outside your organization. Third-party due diligence is the investigative process by which a third party is reviewed to determine any potential concerns involving legal, financial or reputational risks. Due diligence is disciplined activity that includes reviewing, monitoring and managing communication over the entire vendor engagement life cycle.

The Risks Are Real

As we see in the news too often, lapses in leadership around managing third parties have damaged organizations by exposing them to massive fines and penalties. According to the 2016 Benchmark Report, one-third of respondent organizations have faced legal or regulatory issues that involved third parties, with 50 percent of these involving average costs per incident of $10,000 or more. Even if the financial penalty can be managed, the reputational impact can have far-reaching consequences for many years. Third-party risk management is a top concern of compliance leaders, but many organizations are still coming to terms with how best to manage their third parties to limit risk and develop programs based on organizational risk assessments. The 2016 NAVEX Global benchmark report found that many organizations think they could be doing a better job of third-party risk management. Only 58 percent reported that they do a good job of complying with laws and regulations, and less than 25 percent rate their overall program as Good. Organizations may be diligent with their ethics and compliance programs, but for many the risk their third parties represent is a Wild West over which they feel like they have little control.

Benefits of a Strong Third-Party Risk Management Program

Managing third-party risk can make a big difference inhow well your organization can identify, manage and limit the liability a third party can represent. Your third party’s risk is your risk. You should have confidence that your program is minimizing that risk for you and your organization.

TPRClick here to access NAVEX detailed guide

How GRC Strategy & Integration Affects Confidence

Every organization does GRC whether they use the acronym or not. All have some approach to governing the organization, managing risk, and addressing compliance. It could be scattered in silos and disconnected, or it could be highly collaborated and integrated. Organizations should not be asking if they should do GRC but are to ask how mature their organization’s approach to GRC is and how it can be improved.

The formal definition for GRC found in the OCEG GRC Capability Model is that “GRC is a capability to reliably achieve objectives [governance] while addressing uncertainty [risk
management] and acting with integrity [compliance].” In the ideal world there is a natural flow through to GRC.

  • Governance sets objectives and directs and steers the organization setting the context for risk management.
  • Risk management aims to understand and minimize uncertainty in those objectives and reduce exposure to loss while maximizing performance.
  • Compliance assures that the organization operates with integrity to the boundaries established inorganization values, policies, regulatory and legal requirements, as well as boundaries set by risk limits and thresholds.

However, within many organizations there are often many GRC functions operating in isolation producing redundancy and gaps while remaining ignorant of the interrelationship of risk across silos. This has a measurable cost to the organization in
inefficiency, ineffectiveness, and lack of agility. Other organizations have mature and structured processes and reporting on GRC that brings together an integrated and
orchestrated view of GRC processes and information.

The goal of this 2017 OCEG GRC Maturity Survey report is to help organizations:

  • Understand the level of integration of GRC within organizations;
  • Differentiate the degree of confidence in performance with the ability to identify and manage risks and requirements;
  • Examine the benefits of an integrated GRC capability and the negative effects of siloed operations.

Integrated GRCClick here to access OCEG’s detailed analysis.