
December 13, 2023, EIOPA has published a Consultation Paper regarding potential amendments of the prudential treatment of sustainibility risks (EIOPA-BoS-23-460). The expected Article 304a of the Solvency II Directive mandates EIOPA to assess the potential for a dedicated prudential treatment of assets or activities associated substantially with environmental or social objectives, or harm to such objectives, and to assess the impact of proposed amendments on insurance and reinsurance undertakings in the European Union. EIOPA is required to submit a corresponding report to the Commission.
A discussion paper outlining the scope, methodologies, and data sources for the analysis has been published in 2022 as the first outcome of EIOPA’s work under this mandate. This consultation paper is the second outcome, based on the discussion paper’s public feedback received, together with the feedback received from the Platform on Sustainable Finance and the European Banking Authority (EBA). It will form the basis of the report envisaged to be submitted to the Commission after consulting the European Systemic Risk Board (ESRB).
EIOPA decided to focus its analyses on the following three conceptual areas that are considered to be appropriate for a risk-based analysis:
- The first area of the analysis is dedicated to the potential link between prudential market risks in terms of equity, spread and property risk and transition risks.
- The second area of the analysis focuses on the potential link between non-life underwriting risks and climate-related risk prevention measures, since the prudential treatment of assets or activities as referred to in the mandate includes insurance undertakings’ underwriting activities.
- The third area of the analysis is related to the potential link between social risks and prudential risks, including market and underwriting risks.
As a kind of « disclaimer » EIOPA states that « since sustainable finance is an area characterized by an ongoing progress regarding data availability and risk modelling, certain natural limitations of the analysis exist at this stage« :
- Firstly, the sample size of certain asset portfolios for the analysis is relatively small due to general data constraints that can hardly be overcome. Further to this, the limited sample size covered in the present analysis might not reflect the overall insurers’ exposure to transition risks, which could also materialize from indirectly held assets.
- Secondly, since legally binding transition plans of firms, for instance in relation to the Corporate Sustainability Reporting Directive (CSRD), are not yet available, reliable firm-specific characteristics affecting the (long-term) transition risk exposures of firms are difficult to obtain as further input data for the analysis. In this respect, a sectoral classification approach is generally not able to model firm-specific transition risk characteristics, which would require a firm-level approach instead.
- Thirdly, technical challenges for the analysis exist in isolating transition risks from other risk drivers, such as the impact of the Covid-19 shock on asset prices, which is an important determinant for the backward-looking analysis, but not for the forward-looking analysis.
- Fourthly, the exact extent to which credit ratings reflect transition risks remains unclear at this stage, making it challenging in the case of the prudential treatment of spread risk in the Standard Formula whether a dedicated treatment would be justified.
By acknowledging the methodological limitations in the context of assessing sustainability risks from a prudential perspective, EIOPA, at this stage, does not recommend policy options in all areas studied in this consultation paper, and does not express a preference between the options proposed as regards equity and spread risk in relation to transition risk exposures.
Potential link between prudential market risks in terms of equity, spread and property risk and transition risks
The challenging question arises as to whether to rely on historic asset price data to conduct an empirical risk analysis (backward-looking) or to use model-based risk assessments, typically in terms of stress scenarios (forward-looking), or a combination of both.
The feedback EIOPA received to its 2022 discussion paper (« Discussion paper on physical climate change risks ») overall support for the methodologies outlined regarding the forward-looking analysis. Some respondents mentioned that the use of a model-based assessment can be subject to technical bias due to the model assumptions taken, and corresponding findings should be treated with caution regarding the conclusion on potential prudential implications. Several respondents suggested focussing only on a forward-looking assessment, since historic time series data might not be able to show a potential materialization of transition risks.
EIOPA considers forward-looking model-based risk assessments to offer valuable insights into the potential impact of transition risks on asset prices, particularly since historical asset price data may not fully reflect the dynamic nature of environmental externalities and the complexities of transitioning to a low-carbon economy. Market sentiment, technological advancements, regulatory changes, and societal awareness of climate issues can significantly influence transition risks in the future. A comprehensive model-based approach can complement historical data analysis and provide a holistic view of how transition risks may materialize in asset prices.
A forward-looking assessment requires models and assumptions regarding the future developments of climate change and the transition to a carbon neutral economy. In particular, uncertainty surrounds the nature and timing of policy actions, technological change and the extent to which financial markets are already reflecting a transition scenario in asset prices. In other words, the results and conclusions obtained can be quite sensitive to the choices adopted for such parameters and assumptions. To capture such uncertainty, researchers make use of scenario analysis to analyse a broad range of future states of the world.
A number of supervisory authorities – both at national and European level – have developed climate change scenarios to assess the exposure of financial institutions to climate risks in terms of transition risks. EIOPA studied several analyses of climate transition scenarios developed by ACPR/Banque de France, DNB, ECB/ESRB as well as EIOPA/2DII to build a conceptual framework for the forward-looking analysis presented in this section. EIOPA’s discussion paper in 2022 briefly summarised these studies21, whereof the main conclusions are:
- The assessments make use of different scenarios. ECB/ESRB and ACPR/Banque de France use as a basis the climate scenarios developed by the Network for Greening the Financial System (NGFS), DNB developed its own bespoke shock scenario and the EIOPA/2DII sensitivity analysis makes use of transition scenarios developed by the International Energy Agency (IEA);
- The analyses use two ways to measure the impact of disorderly transition scenarios by either comparing them with the baseline results for an orderly transition or with the current, no policy change pathways;
- The forward-looking assessments employ several models to translate high-level climate scenarios into pathways for equity and corporate bond prices at sector level using either the NACE breakdown of economic activities or – in case of the EIOPA/2DII sensitivity analysis – fifteen climate-policy relevant activities;
- The assessments exhibited substantial differences in exposures to transition risk for the various economic activities and technologies. On the one hand, equity exposures to mining and power generation would be fully stranded in the DNB combined policy and technology shock scenario. On the other hand, equity exposures to renewable energy would double in value in the EIOPA/2DII late and sudden policy shock scenario.
A mapping of the Transition Vulnerability Factors (TVFs) developed by the DNB on the NGFS’s transition risk scenarios to assess the potential exposure of economic activities to transition risks from a forward-looking and risk-oriented perspective. The TVFs capture the sensitivity of stock returns to forward-looking scenario-specific excess market returns, for instance in case of a rise in carbon prices or a technological shock. Based on this mapping exercise, the economic activities that seem to be particularly exposed to transition risk from a forward-looking perspective are the following:
- B05-09 – Mining and quarrying (coal, lignite, crude petroleum, natural gas, etc.);
- C19 – Petrochemical;
- C22 – Manufacture of rubber and plastic products;
- C23 – Manufacture of non-metallic mineral products;
- C24 – Manufacture of basic metals;
- D35 – Utilities (electricity, gas, steam and air conditioning supply);
- H50 – Water transport and
- H51 – Air transport.
It is important to differentiate economic activities that might be able to follow a transition to a low carbon economy in the future from those which might not. Indeed, in terms of carbon footprint, sectors related to the extraction, production, processing, transportation and reselling of fossil fuels will hardly be able to reduce their carbon emission levels as it is directly linked with their activity. In this regard, the Platform on Sustainable Finance (PSF) states that “the Platform recognizes there are other economic activities for which no technological possibility of improving their environmental performance to avoid significant harm exists across all objectives and which might be thought of as ‘Always Significantly Harmful’ activities”, referring particularly to economic activities B5 (Mining of coal and lignite), B8.92 (Extraction of peat) and D35.11 (Power generation from solid fossil fuels). According to article 19(3) of the taxonomy regulation, power generation activities that use solid fossil fuels do not qualify as environmentally sustainable economic activities.
Three possible types of transition scenarios can be envisaged in the coming decade:
- An orderly type of transition scenario in which there is no or little impact on the real economy and financial sector. This type of scenarios consists of a timely and predictable path to a carbon-neutral economy with companies gradually adjusting their business models and capital stock to this new reality. An orderly transition is considered to be the baseline scenario in the ACPR and ECB/ESRB transition stress tests.
- A disorderly type of transition scenario where there is a substantial impact on the real economy and – through their asset exposures to carbon-intensive sectors – the financial sectors. This type of scenarios tends to be characterised by unexpected, sudden and delayed actions to achieve carbon-neutrality. A disorderly scenario is generally considered to be a low probability, but yet plausible event.
- A type of scenario where there is no transition or an insufficient transition to a carbon-neutral economy. Such a type of scenarios is also bound to have substantial negative impacts on the real economy and financial sector. Not due to transition risk, but as a consequence of a further increase in (acute) physical risks, like floods, fires and storms that may damage production facilities and disrupt supply chains.26 However, such risk differentials will materialise in another dimension, i.e. depending on the geographical location of companies rather than their carbon sensitivity.
Given that a disorderly transition poses the biggest transition risk, a prudential forward-looking VaR-analysis should focus on transition risk differentials relating to a disorderly scenario. Since it is difficult to estimate the probability of such a scenario, it is proposed to assess its impact under various annual probabilities of occurrence, e.g. ranging from 0.5% to 4.5% per year. To put these annual probabilities into a longer-term perspective, assume for example that the probability of an orderly transition amounts to 50% during the coming decade. The annual probabilities of 0.5-4.5% will then translate in a cumulative probability of 5-30% after 10 years, leaving a cumulative probability of no (or insufficient) transition of 20-45%.
Equity Risk: Backward-Looking Results
Results of the Broad Portfolio Allocation Approach

Results of the Narrow Portfolio Allocation Approach : CPRS (Climate Policy Relevant Sectors) – based Portfolio Allocation)

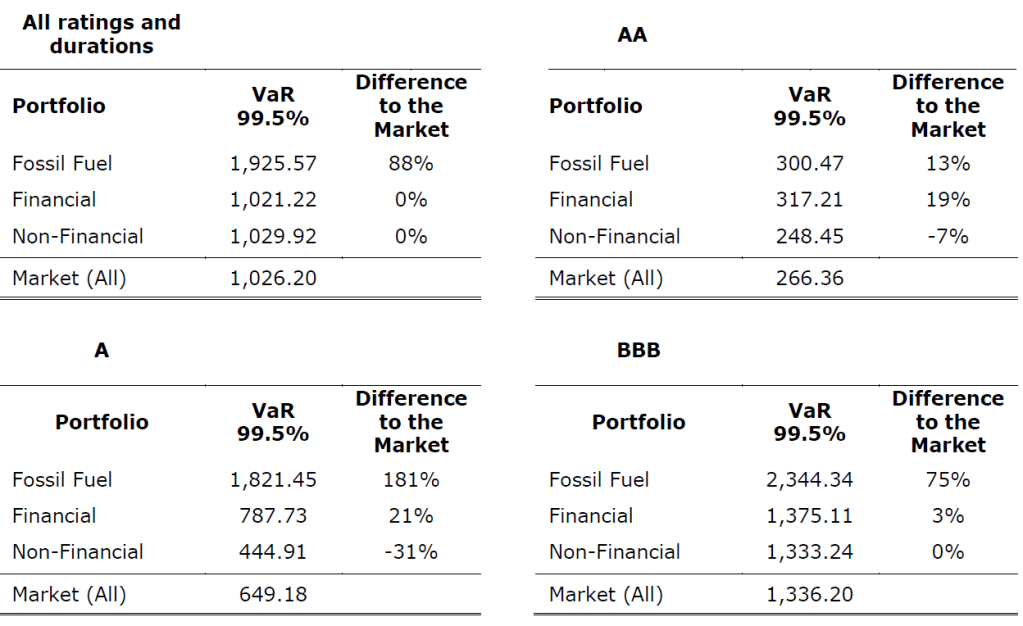
Overall, the fossil fuel sector shows a differentiated risk profile relative to the other sectors in terms of the highest VaR (-56.5%) in the relevant time period from 2010-2021. This sector includes the following NACE codes: B5, B6, B8.92, B9.1, C19, D35.2, H49.5, G46.71, which mainly relate to activities associated with the extraction of crude oil, natural gas and the mining of coal. A large number of studies underline that these activities, due to their inherent carbon intensity and limited potential to transition, tend to be more exposed to transition risks, as European economies gradually converge towards the objectives set out by the 2015 Paris Climate Agreement and the EU Green Deal.
Equity Risk: Forward-Looking Results
The forward-looking analysis uses the projected equity shocks for the different economic sectors being distinguished in:
- the sudden (1) and delayed (2) transition scenarios of ACPR;
- the policy shock (3), technology shock (4) and double (or combined) shock (5) scenarios of DNB;
- the delayed transition (6) scenario of ESRB/ECB;
- the disorderly transition (7) and ‘too little, too late’ (8) scenarios of IAIS.
In the Monte Carlo simulations, if a disorderly transition scenario materialises, a probability of 1/8 is attached to each of these eight specific scenarios occurring.


Equity Risk Differentials (Monte Carlo)

Spread Risk: Backward-Looking Results
Since the aggregation of various different economic activities into high-level portfolios as regards transition risk exposures appears suboptimal for assessing the potential for a risk differential, the assessment focuses on the narrow portfolio approach, in particular regarding fossil fuel-related bonds.
Spread Risk: Forward-Looking Analysis
In line with the forward-looking analysis for equity risk, the transition return shocks for corporate bonds for the different economic activities are derived from the disorderly transition scenarios of ACPR (sudden and delayed transition scenarios), DNB (policy, technology and double shock scenarios), ESRB/ECB (delayed transition scenario) and IAIS (disorderly and ‘too little, too late’ scenarios). In the Monte Carlo simulations, if a disorderly transition scenario materialises, a probability of 1/8 is attached to each of these eight specific scenarios occurring.


Spread Risk Differentials (Monte Carlo)

Stocks and Bonds: EIOPA’s Potential Policy Options
Based on the detailed analysis, EIOPA describes and evaluates three potential options for both asset classes:
Equity Risk (options and EIOPA’s evaluation)
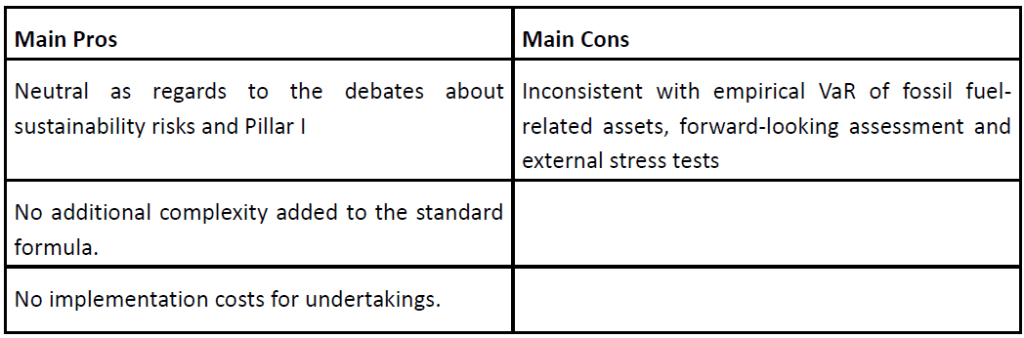
- Option 1: “no change”-option
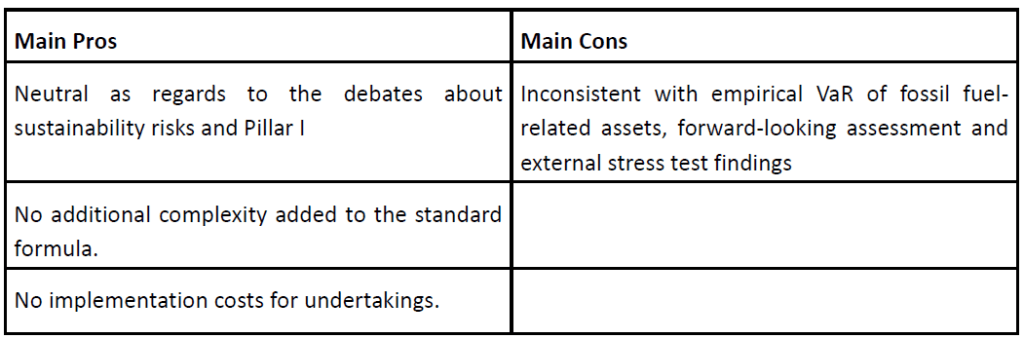
- Option 2: treating fossil fuel-related stocks as Type II (stocks listed outside EEA and OCDE markets) equity, i.e., a capital charge of 49% rather than 39% for Type I equities;

- Option 3: a dedicated supplementary capital requirement to the current equity risk calibration with supplementary capital charge to the current Standard Formula’s risk charge of 39%, in case of Type I equities, could lie in the range up to 17% in additive terms, i.e., 39%+17%=56%. Regarding the role of participations or long-term equity, exclusion criteria for fossil fuel-related activities or a potentially higher capital requirement may be needed to limit incentives to re-classify Type I/II stocks as participations for the sake of SCR reduction.

Spread Risk (options and EIOPA’s evaluation)
- Option 1: no change option.
- Option 2: a rating downgrade of bonds related to fossil fuel activities,

- Option 3: a dedicated supplementary capital requirement to the current spread risk calibration, up to 5% in additive terms, which corresponds to an increase in the capital requirements of up to 40% relative to the bond portfolio’s current capital requirement.

An impact assessment conducted by EIOPA shows a very low impact of the proposed policy options on the solvency ratio of the undertakings (cumulated range equity and spread on Germany’s and France’s solvency ratios from -0.21 to -1.71%p) mainly due to the undertakings’ limited exposure to directly held fossil fuel-related assets. The low impact on the undertakings’ solvency ratio thereby suggests a limited impact on the asset allocations of undertakings in terms of potentially triggering fire-sales of fossil fuel-related assets that could contribute to systemic risks in the financial system. Moreover, it is important to note that besides capital charges, insurers take further criteria for their investment decisions into account, such as objectives in terms of duration and cash flow matching between assets and liabilities, further limiting the potential of the proposed policy options to trigger material re-allocations in the undertakings’ asset portfolios. It is therefore concluded that the proposed policy options would not materially contribute to systemic risks in the financial system.
Property Risk and Energy Efficiency
Regarding property risk, the Standard Formula in Solvency II currently foresees a shock to the market value of buildings of 25%. The shock has been calibrated as the annual 99.5%-Value-at-Risk (VaR) of monthly total return real estate indices and does not distinguish between commercial or residential real estate.
To study the potential effect of energy efficiency on property risk, EIOPA proposed in its discussion paper to construct property price indices based on samples of buildings with the same energy performance level, while controlling for major property characteristics typically driving the market value of a building. The energy performance-related price indices track the average price series of a specified reference building over time, and allow to calculate the corresponding annual returns. From a prudential perspective on property risk, a comparison of the annual Value-at-Risk values at the 99.5% confidence level across the energy performance-related price indices can provide evidence on a potential energy performance-related risk differential for property risk.
The two main variables of interest for the analysis are the building’s energy performance and its market value. EIOPA suggested in its discussion paper to use the building’s energy performance certificate (EPC) as a categorical measure of its level of energy efficiency. In this regard, the energy performance of a building is defined as the amount of energy needed to meet the building’s energy demand associated with a typical use of the building in terms of heating, cooling, ventilation, hot water and lighting. The EPCs typically range from A+ (most efficient) to H (least efficient), and using EPCs as a determinant for transition risk exposures was broadly supported in the public consultation. Moreover, energy performance certificates are also used as measure for the energy performance of buildings under the corresponding technical screening criteria of the EU Taxonomy.
The building’s market value, measured for the analysis as a building’s advertised sales price, is scaled by the building’s size (typically the square meter of living area for residential buildings) to reduce selection bias and to raise comparability of prices across buildings. Due to the impact of inflation on the market value of buildings, the building’s sales price in a given year is deflated for the analysis.
A range of factors can typically influence a building’s market value, such as location and age, and should be controlled for when grouping comparable buildings together to construct the house price indices. Generally, grouping data in relation to multiple house characteristics to reach homogeneous groups for comparison can materially limit the number of available price observations to construct respective price indices. In particular, residential buildings are typically infrequently sold during their lifetime, constraining materially the scope of building-specific time series data that could be used to track pricing effects. Therefore, a general tradeoff between complexity (granularity) in terms of building characteristics to construct homogeneous groups of buildings and the sample size arises, and a sufficient balance needs to be found.
To study the effect of a building’s level of energy efficiency on property risk from a backward-looking perspective, energy performance-specific property price indices based on the German residential housing market and advertisement data have been constructed.
The findings of EIOPA’s backward and forward-looking analysis together with a risk differentials based sensitivity study show an inconsistent effect of the level of energy efficiency on property risk in terms of the 99.5% Value-at-Risk of annual property returns. In contrast, the forward-looking analysis finds an increase in the riskiness of properties with energy labels F and G, i.e. the two least energy-efficient classes of property.
Since the quantitative findings from a backward- and forward-looking perspective show mixed evidence, EIOPA cannot conclude whether a dedicated prudential treatment of energy efficiency under the property risk sub-module in Solvency II’s Standard Formula could be justified.
As the analysis is subject to various data limitations that could not have been overcome by means of the public consultation of EIOPA’s discussion paper in 2022, EIOPA suggests a repetition of the analysis, particularly in context of the developments of the Energy Performance of Buildings Directive (EPBD), which aims for a consistent assessment of the energy efficiency of buildings in the EU and for improving corresponding data availability. It can therefore be expected that more data suitable for a property risk analysis as regards energy efficiency will be available in future.
Non-Life Underwriting and Climate Change Adaptation
The expected growth in physical risk exposures and insurance claims due to climate change will increase risk-based premium levels over time, potentially impairing the mid- to long-term affordability and availability of insurance products with coverage against climate-related hazards. Moreover, the increased frequency and severity of natural disasters and extreme weather events associated with climate change can make it more difficult for insurers to predict the likelihood of future losses accurately and to price insurance products appropriately.
Climate-related adaptation measures are defined as structural and non-structural measures and
services that are implemented by (re)insurance undertakings or policyholders ex-ante to a loss event, which reduce the policyholder’s physical risk exposure to climate-related hazards through
- lowering the frequency of climate-related losses or
- lowering the intensity of climate-related losses in an underwriting pool.
Climate-related adaptation measures can differ substantially regarding their form and ability to protect against climate-related hazards. Specific examples of climate-related adaptation measures discussed in the insurance context comprise:
- measures related to a building’s structure like water-resistive walls, windows and doors or non-return valves on main sewer pipes against flood risk,
- external building measures such as sandbags against flood risk,
- heat- and fire-resistive construction materials for buildings against exterior fire exposures,
- the irrigation of crop fields against drought risk and heat waves and
- non-structural measures such as forecasting and warning systems (e.g., SMS) to enable policyholders to protect their goods in advance of severe weather events.
From a risk-based perspective, a clear link between climate-related adaptation measures and insurance premiums is given, as adaptation measures aim to reduce the policyholders’ physical risk exposures and insured losses associated with climate change, and thereby contribute directly to reducing the actuarial fair premium of an insurance contract. In contrast, climate-related mitigation measures focus on actions to reduce greenhouse gas emissions, for which a direct risk-based link to the actuarial fair premium does not necessarily exist. For instance, while motor insurance products focusing on electric vehicles contribute to reducing the emission levels associated with an underwriting pool, the lower emission levels do not directly affect the loss profile of the underwriting pool in terms of the frequency and intensity of claims. Therefore, climate-related mitigation measures are excluded from the scope of this analysis.
The prudential requirements for non-life underwriting risks in Solvency II’s Standard Formula comprise three main modules:
- the premium – refers to future claims arising during and after the period of the solvency assessment (covered but not incurred, e.g., in relation to the provision for unearned premiums) – and reserve – refers to past risks and claims that have already materialized (provision for outstanding claims) – risk module,
- the catastrophe module – potential losses from extreme and rare tail events, which are expected to happen more frequently and becoming more intense due to climate change – and
- the lapse – instantaneous loss of 40% of the in-force business – risk module.
As per EIOPA, Particularly the first two modules can be considered materially sensitive to climate change and its impact on the frequency and intensity of severe weather- and natural catastrophe events. This statement can be challenged as we believe that increasing non affordability of insurance might well have an impact on lapse risk and feed-back on the consultation paper might well add it as being material.
Premium Risk
Premium risk in the Standard Formula is treated by means of a factor-based approach. In particular, the standard deviation of the underwriting pool’s loss ratio, which basically relates to the ratio of claims incurred to premiums earned, is driving the premium risk from a prudential perspective. The capital charge is determined to be consistent with the 99.5% percentile of the loss ratio’s distribution to cover unexpected shocks to the claims and premiums of the insurance undertaking in a given year.
Since climate change and its impact on physical risks materializes dynamically over time, for instance due to the dependance on changes in (global) temperature levels which in turn depend on greenhouse gas emission levels, historic data might not be an appropriate predictor of future trends, making it difficult for insurers to accurately predict the likelihood of future claims.
Climate-related adaptation measures can reduce the frequency and severity of weather- and climate-related losses in an underwriting pool and thereby smooth the claim’s distribution and lower the standard deviation of the loss ratio. In that regard, the risk of mispricing insurance policies due to climate change could be reduced, as the adaptation measures limit the potential for claims realizing in a given year to deviate materially from the expected outcome on which the premium level of the underwriting pool has been set before. The volume measure in terms of the net premiums earned is the second factor in the Standard Formula to determine premium risk from a prudential perspective and can be interpreted as a measure to scale the overall level of premium risk and the corresponding capital charge for the individual insurance undertaking. As the premium level of an underwriting pool is based on the expected volume of claims in a given year, the volume measure covers the expected losses.
Reserve Risk
Reserve risk captures the risk that the absolute level of claims provisions for an underwriting pool could be mis-estimated, i.e., that reserves are not sufficient to settle down the claims that occurred already in the past. As for premium risk, reserve risk is supposed to cover small to medium loss events and not tail events.
The prudential reserve risk is measured by means of a volume measure (net provisions for claims outstanding) and a parameter for standard deviation for the claim payments. Climate-related adaptation measures are expected to reduce the volume measure in terms of the net provisions for claims outstanding. Hence, the expected effect of adaptation measures on insurance reserves will be captured by the volume measure. The variation of costs to settle down claims that have already occurred in the past, however, does not seem to be materially affected by the fact of implementing climate-related adaptation measures in insurance products. Therefore, it is not expected that climate-related adaptation measures will have an impact on the standard deviation parameter driving reserve risk and is therefore studied only qualitatively.
Natural Catastrophe Risk
Under Solvency II, undertakings can take the risk reducing effect of climate-related adaptation measures into account when applying a suitable internal natural catastrophe model for estimating the corresponding capital requirements, but not under the Standard Formula. However, the effects of climate-related adaptation measures on the solvency capital requirements for natural catastrophe risk are difficult to predict, as they depend substantially on the catastrophe model used, the climate-related hazard considered, the risk characteristics of the adaptation measure modelled and the localisation of the risk exposure. Moreover, for example large-scale and expensive adaptation measures like flood-resistant walls might raise materially the value of a building, and thereby raise the sum insured, which in turn will raise the corresponding solvency capital requirement for natural catastrophe risk.
EIOPA focus un Premium Risk
Given the early stage of the EU insurance market regarding the implementation of adaptation measures in insurance products, particularly since current measures usually implemented are rather small-scale measures less effective against tail events captured by the natural catastrophe risk charge, but more effective against small and medium loss events captured by the premium risk charge EIOPA focuses its quantitative analysis on premium risk. Reserve risk and natural catastrophe risk are studied by means of qualitative questions that have been raised in the data collection with insurance undertakings in 2022. Future work could look more deeply into the quantitative influence of adaptation measures on the solvency capital requirements for natural catastrophe risk given further market progress in implementing adaptation measures in insurance products has been achieved providing sufficient data as regards their impact on claims related to tail events.
In order to study the influence of climate-related adaptation measures on premium risk, the annual loss ratios are calculated, both for portfolios with and without adaptation measures based on the 33 responses including data for 15 million policyholders of EIOPA’s 2022 consultation. Data is grouped into three main categories of climate-related adaptation measures for illustrative reasons:
- Hail nets, tempered glass and garages, which have a conceptually similar effect against hail risk – referred to as the “Hail protection”-group
- Weather warning systems (e.g. SMS, e-mail, etc.) – referred to as the “Warning systems”-group
- Other adaptation measures (e.g. building codes) – referred to as the “other adaptation”-group

Standard deviation on Premium Risk

EIOPA’s Summary and Policy Recommendation
The sample for the analysis is very small, as it comprises only eleven underwriting pools. The EU insurance market is at a relatively early stage regarding the implementation of climate-related adaptation measures as defined in this exercise, which naturally limits the amount of potential data to be studied. In this regard, the Standard Formula’s requirement of at least five years of data for the assessment of the standard deviation parameter further constrained the scope of underwriting pools eligible for the analysis. Therefore, it is likely that the data sample studied does not fully capture the effects of adaptation measures, particularly in context of potential variations in terms of adaptation measures, climate perils, spatial exposures, etc.
At this stage, EIOPA does not recommend changing the prudential treatment of premium risk in context of climate-related adaptation measures. Due to the importance of climate-related risk prevention to ensure the long-term availability and affordability of non-life insurance products, EIOPA suggests a repetition of the analysis, provided that the availability of data has improved resulting from further market developments in this regard. In addition, an extension of the prudential analysis to the solvency capital requirements for natural catastrophe risk is suggested.
Social Risks and Impacts from a Prudential Perspective
EIOPA provides an initial analysis of the Pillar II and III requirements under Solvency II, to identify potential areas for further work. Given the material lack of social-related data and risk models regarding the social aspects of investment and underwriting activities of insurers, EIOPA did not conduct a Pillar I-related assessment in response to the mandate.
Social sustainability factors.
Social sustainability factors are commonly referred to in respect of “social and employee matters, respect for human rights, and anti-corruption and anti-bribery matters”.
SFDR (Sustainable Finance Disclosure Regulation) lists the following families of factors also used in the ESRS (European Sustainable Reporting Standards):

Social Impacts
The SFDR social adverse impacts include aspects as gender pay gaps between female and male employees, lack of workplace accident prevention policies, human rights policy or of a diligence process to identify, prevent, mitigate and address adverse human rights impacts.
The Social Taxonomy Report issued by the Platform on Sustainable Finance identifies as examples of socially harmful economic activity the involvement with certain kinds of weapons or the production and marketing of cigarettes.
Social Risks
Social risks refer to (financial) risks including those deriving from dependencies on human and social resources and those affecting working conditions and living standards, communities and consumers / end-users.
Social risks can arise from (macro-level) socio-economic developments as well as from entities or individual behaviour.
They can transmit into society
- directly (e.g. events causing unemployment, health or security issues (such as pandemics, cyber threats)),
- indirectly (‘second order’, e.g. rising price levels leading to financial distress, the risk of unemployment spreading into health or safety risks) and
- through spill-over impacts (‘contagion’) affecting, for example, the financial system (e.g. unemployment leading to mortgage defaults, resulting in increased mortgage insurance pay outs and causing potential financial sector stability issues).
These risks can then transmit into risks for (re)insurance activities. For example, economic difficulties could lead to a decrease in the ability of citizens and companies to insure themselves or to pay their premiums.
Social Transition and Physical Risks
Social transition risk can result from the misalignment of economic activities with changes in policy, technology, legal requirements or consumer preferences which aim at addressing social negative impacts, such as for example inadequate working conditions or discrimination.
While social risks are primarily non-physical in nature, they can also give rise to physical / mental health consequences, especially when they affect working, safety and living conditions. Social risks related to inequality, discrimination, or human rights abuses can also for example lead to social conflicts which may have physical consequences in the form of property damage resulting from violence.
Social Risks for Insurers from a Prudential Perspective
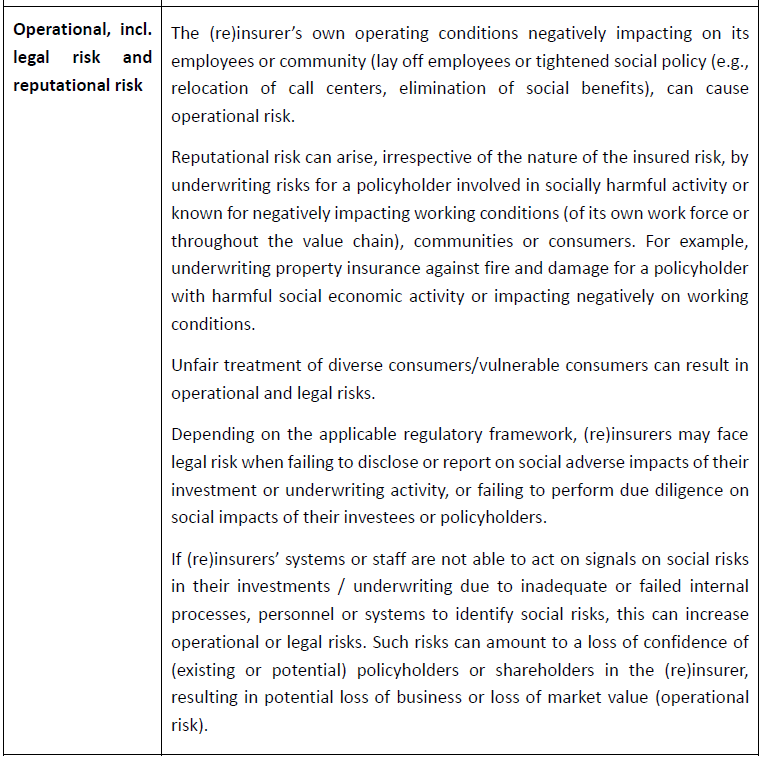
Social risks can translate into prudential risks in the form of underwriting, market, operational (incl. legal) or reputational risks.


Pillar I Prudential Treatment
To perform a quantitative analysis to assess the potential for dedicated capital charges related to social risks, in line with risk- and evidence-based principles, would require large (international) consensus on appropriate definitions of risk channels as well as comprehensive and granular data on social risk factors in conjunction with appropriate risk models, which are not available to date. Hence, EIOPA does not conduct a Pillar I-related analysis in response to the expected mandate.
Pillar II Prudential Treatment
This chapter of EIOPA’s consultation clearly favours ORSA as being today’s most appropriate tool to deal with Social Risk Management. We agree with this initial strategy as it will enable regulators to build a real framework potentially impacting Pillar I and III within the next two to three years. However, based on the recent experience with ORSA, it would be useful to guide (re)insurance undertakings once the first ORSA reports including these issues filed to NCA. A Dry Run ORSA including these new criteria – like the one we experienced prior to 2016 – could be a good strategy to meet expectations.


High level social risk materiality assessment
(Re)insurers can conduct a high level (qualitative) social risk materiality assessment based on exposure to geographies, sectors or lines of business. The materiality of the exposure would form a proxy to vulnerability and materiality of the risk, in a first step of a risk materiality assessment.
- Social risk – geographical exposure. For example, the Allianz social risk index118 identifies countries that are most vulnerable to systemic social risk. Indicators providing measures for social inequality or development can also provide indications on geographical exposure to social risks, such as the World Bank’s World Development Indicators featuring among others social indicators on labor, health, gender; the Gini index measures the distribution of income across a population; the UNDP human development indicator summarizes achievement in key dimensions of human development across countries.
- Social risk – sectoral exposure. The exposure of assets or liabilities to economic activities in ‘high social risk sectors’. For example, the Business and Human Rights Navigator (UN Global Compact) can help mapping exposure to sectors at high risk of relying on child labour, forced labour, or sectors negatively impacting on equal treatment (incl. restrictions to freedom of association) or on working conditions (inadequate occupational safety and health, living wage, working time, gender equality, heavy reliance on migrant workers) or have negative impacts on indigenous people. For these issues, the Navigator identifies industry-specific risk factors, aiming to illustrate the issue for certain sectors such as agriculture, fashion & apparel, mining, travel & tourism. The navigator also identifies due diligence steps that companies can take to eliminate the specific social risks in their operations and supply chains. Information on the social sustainability of the economic activity the insurer is underwriting or investing in, can be sourced from companies’ corporate reporting on social risks and impacts under the Corporate Sustainability Reporting Directive (CSRD), as will be implemented by the European Sustainability Reporting Standards.
- Social risk – insurance lines of business exposure. Some insurance lines of business may be particularly exposed to social risks. For example, the PSI ESG Underwriting Guide for Life and Health Insurance123 and the Geneva Association’s heat map of potential ESG risks in property and casualty underwriting124 identify social factors that may (negatively/positively affect) health or life and non-life insurance risks. Social adversity and lifestyle behaviour is known to affect health and with it, potential health insurance claims. Workers’ compensation claims are likely to be at risk of an employer’s poor work force policies. Other social/societal factors, such as housing insecurity or lack of education can influence (in)directly the outcome of workers’ compensation claims.
Practices for Mitigating Social Risks & Impacts: The Investment Strategy and Decisions
- Limiting investment in or divesting from socially non-sustainable activities/companies: The exclusion of an investee harming social objectives from the investment portfolio can follow the identification of a socially harmful activity, based on two sources: internationally agreed conventions (e.g., certain kinds of weapons) or research on the detrimental effects of certain activities (e.g., detrimental effect of tobacco use). Thresholds for investments in such companies can be set, or exclusions from investments in these sectors pursued. Minimum social safeguards can serve as a guiding principle.
- Impact investing and stewardship:
- The (impact) investment strategy would direct investments at economic activities aiming to achieve explicitly social goals. For example, the funding of health research, through targeted investments in dedicated undertakings or investment in financial literacy programs may contribute to social objectives to improve living standards or access to relevant products to secure financial safety.
- Engagement and voting on sustainability matters (as part of a stewardship approach) can aim to influence firms of which (re)insurers are shareholders. This supposes the (re)insurer can persuade the investee to act on social objectives and requires a certain degree of influence or leverage that the (re)insurer can reasonably exercise. (Re)insurers can use their engagement and voting rights to improve performance of those companies against the social objectives.
- A ‘best-in-class strategy’ would consist in selecting investee companies with excellent social performance, regardless of the sector which they belong to. Such an investment approach can support companies to transition to a more socially sustainable business model. (Re)insurers can seek to ensure that those firms they invest in measure up to social objectives, especially in ‘high risk’ sectors, ensuring, for example that they provide appropriate wages, or that they operate safe working environments.
- Such risk mitigating or adaptation actions can be informed by considering the SFDR principal adverse impacts of the investee companies’ activities. The so-called ‘minimum social safeguards’ as referred to in the Taxonomy Regulation can also provide a minimum standard for implementing a social prudent person principle for investments, in line with Solvency II.
Practices for Mitigating Social Risks & Impacts: The Underwriting Strategy and Decisions
- Limiting underwriting of socially non-sustainable activities: Similar to investments, insurers could opt not to insure companies (belonging to a sector) known for unsustainable or harmful social practices in its own operations or value chain, or negatively impacting communities or consumers.
- Impact underwriting and services: Through targeted underwriting activity, products and services, insurers could bring additional social benefits that directly contribute to the realization of social objectives for end-users and consumers as well as for affected communities (directly or through the value chain). There may be scope for insurers, through their underwriting strategy and decisions, to incentivize policyholders to manage losses arising from social risks. This may be through the provision of services or the potential reduction of premia for risk reducing measures taken by the policyholder, consistent with actuarial risk-based principles. Via underwriting, insurers could also ensure their product offerings and distribution practices consider the demands and needs of a diverse range of clients. Through their underwriting they need to ensure exclusions do not unfairly target and discriminate consumers with non-normative traits and/or vulnerable consumers.
- For example:
- The integration of social risk mitigants into, for example, surety bond underwriting for infrastructure projects can also contribute to reducing losses from underwriting due to social risks.
- Risk mitigants can be part of underwriting conditions for workers’ compensation policies requiring companies to impact on the health of their workers through the pay they provide, the security of contracts they offer, and through the provision of benefits such as sick pay, parental leave, health insurance and other health-related schemes.
- The establishment of sectoral risk sharing capacities at local, regional or national level, where applicable with government involvement, can contribute to social risk mitigation, for example by improving risk assessment for communities and societies and reducing losses from socio-economic risk events.
- For example:
Pillar III Prudential Treatment
Considering the nascent reporting requirements on social risks and impacts under SFDR and CSRD, EIOPA is not proposing at this stage to develop additional (prudential Pillar III) reporting or disclosure requirements regarding social risks and impacts in Solvency II. Further analysis would be required as to whether quantitative prudential reporting requirements could inform the corresponding prudential treatment of (re)insurers assets and liabilities.
